Difference between revisions of "ICT student textbook/How to make data meaningful"
Jump to navigation
Jump to search
| Line 34: | Line 34: | ||
=Description of activity with detailed steps= | =Description of activity with detailed steps= | ||
==Teacher led activity== | ==Teacher led activity== | ||
| − | {|class="wikitable" | + | {| class="wikitable" |
|- | |- | ||
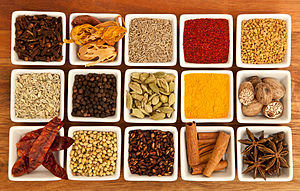
| − | |style="width: 20%;|[[File:Indian_Spices.jpg|300px|Indian spices]] | + | | style="width: 20%;" |[[File:Indian_Spices.jpg|300px|Indian spices]] |
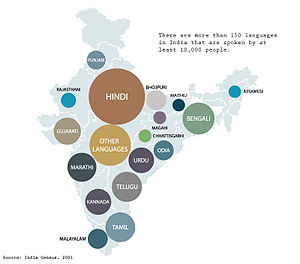
| − | |style="width: 20%;|[[File:Indian-languages-map.jpg|300px|Indian languages]] | + | | style="width: 20%;" |[[File:Indian-languages-map.jpg|300px|Indian languages]] |
| − | |style="width: 60%;| | + | | style="width: 60%;" | |
#Your teacher will use these data sets to discuss how data elements can be identified for any set of data | #Your teacher will use these data sets to discuss how data elements can be identified for any set of data | ||
#Each data element will have a value associated with it and the data can be organized along those values | #Each data element will have a value associated with it and the data can be organized along those values | ||
| Line 63: | Line 63: | ||
#Data collected and tabulated (this can be non digital and can be digitized in subsequent activities) | #Data collected and tabulated (this can be non digital and can be digitized in subsequent activities) | ||
#Text document with the data sets collected | #Text document with the data sets collected | ||
| − | |||
| − | |||
| − | |||
| − | |||
| − | |||
Revision as of 16:47, 17 October 2016
Title of Activity
Objectives
- Data can be organized for meaning making
- Identifying data elements to capture for organizing data
- Identifying method of organizing that will allow you to answer the questions (building a table for data)
- Understanding the importance of representing data in pictures
What prior skills are assumed
- What prior skills are assumed
- Understanding of different types of data
- Creating folders and saving files
- Opening a given file with the correct application
- Familiarity with using a key board and text input (Telugu)
Resources needed
Hardware, software, File
- Data in the form of bar graphs, pictographs, maps (images)
- Computer lab with projection
- Handout - Learn Ubuntu
- Handout - Learn LibreOffice Writer
- Handout - Learn Tux Typing
Digital skills
- Working with different files and applications
- Creating and editing a text document
Description of activity with detailed steps
Teacher led activity
Student activities
In this section we will focus on creating data sets in the class. The following activities can be take up by different sets of students.
- Know your neighbourhood: In groups, students could take up surveys of the school or home neighbourhood. Some of the parameters for building the data set include the types of houses, the number of household members, the number of houses with school going students, the number of houses with students in college, the number of houses with cooking gas connection.
- Profile of the newspaper : Pick 3-4 newspapers from your library. Collect the following data for each newspaper.
- Date of the newspaper.
- Day
- Total number of pages in it.
- Price of the newspaper.
- Name of the editor.
- Number of comic strips/ games/ puzzles/ crossword.
- Number of Letters to editor.
- Number of advertisements.
- What are we eating This is to track the nutrition for students. Collect the various data elements around the mid-day meal in terms of the ration , fuel, grains and lentils consumed and vegetables
- Organizing our ICT resources: Revisit the data sets created in the school lab computers for the activity What all can a computer do. Organize the resources in terms of features like size of the file, type of the file, application needed to open it and how this file could be used.
- Studying the flags of the world: #With a collection of flags of various countries, try to organize them based on various parameters like colour, shapes contained, symbols contained and so on. This data can be tabulated for analysis.
Portfolio
- Data collected and tabulated (this can be non digital and can be digitized in subsequent activities)
- Text document with the data sets collected


