Difference between revisions of "ICT student textbook/Data can tell stories"
Jump to navigation
Jump to search
| (32 intermediate revisions by 5 users not shown) | |||
| Line 1: | Line 1: | ||
| − | {{Navigate|Prev=Data representation and processing level 1|Curr=Data can tell stories|Next=How to make data meaningful}} | + | [http://karnatakaeducation.org.in/KOER/index.php/ಐಸಿಟಿ_ವಿದ್ಯಾರ್ಥಿ_ಪಠ್ಯ/ದತ್ತಾಂಶ_ಕಥೆಗಳನ್ನು_ಹೇಳಬಹುದು ಕನ್ನಡ]{{Navigate|Prev=Data representation and processing level 1|Curr=Data can tell stories|Next=How to make data meaningful}} |
| + | |||
| + | {{font color|brown|'''<big><u>Data can tell stories'''</u></big>}}<br> | ||
| + | {{font color|brown|In this activity, you will learn to see different formats of data and try to interpret the data.}} | ||
| + | |||
'''Data can tell stories''' | '''Data can tell stories''' | ||
<div class="noprint" style="float:right; border:1px solid blue;width:300px;background-color:#F5F5F5;padding:2px;"> | <div class="noprint" style="float:right; border:1px solid blue;width:300px;background-color:#F5F5F5;padding:2px;"> | ||
{| cellspacing="0" | {| cellspacing="0" | ||
| [[File:Book.jpg|none|80px|Book image]] | | [[File:Book.jpg|none|80px|Book image]] | ||
| − | | style="padding-left:2px;" | Go to <br /> [[ICT teacher handbook/Data representation and processing|Teacher | + | | style="padding-left:2px;" | Go to <br /> [[ICT teacher handbook/Data representation and processing|ICT Teacher Handbook]] |
|}</div> | |}</div> | ||
| − | =Objectives= | + | ===Objectives=== |
| − | # | + | #Understanding that data can be in different formats |
#Reading different kinds of data to make meaning | #Reading different kinds of data to make meaning | ||
| − | #Analyzing and expressing | + | #Analyzing data and expressing |
| − | =What prior skills are assumed= | + | ===What prior skills are assumed=== |
| − | #Creating folders and saving files | + | #[[Learn Ubuntu|Creating folders and saving files]] |
#Opening a given file with the correct application | #Opening a given file with the correct application | ||
| − | #Familiarity with using a key board | + | #[[Learn Tux Typing|Familiarity with using a key board]] |
| − | = | + | ===What resources do you need=== |
| − | + | # Working computer lab with [[Explore a computer|projector]] | |
| + | # Computers installed with [[Learn Ubuntu|Ubuntu Operating System]] | ||
| + | #[[Learn Firefox|Access to internet]] | ||
#Data in the form of bar graphs, pictographs, maps (images) | #Data in the form of bar graphs, pictographs, maps (images) | ||
| − | # | + | #Handout for [[Learn Ubuntu|Ubuntu]] |
| − | # | + | #Handout for [[Learn Tux Typing|Tux Typing]] |
| − | #Handout | + | #Handout for [[Learn LibreOffice Writer|LibreOffice Writer]] |
| − | #Handout - [[ | + | #Handout for [[Learn Freeplane|Freeplane]] |
| − | # | + | |
| + | ===What digital skills will you learn=== | ||
| + | #Creating and navigating folders (and sub-folders) | ||
| + | #Opening multiple files with multiple applications | ||
| + | #Text entry (local languages) | ||
| + | |||
| + | ===Description of activity with detailed steps=== | ||
| + | ====Teacher led activity==== | ||
| + | {| class="wikitable" | ||
| + | |- | ||
| + | | style="width: 35%;" |[[File:India - Sights & Culture - 32 - woman fetching water (2458024353).jpg|left|thumb|200x200px]] | ||
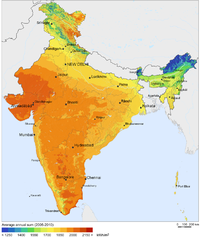
| + | | style="width: 25%;" |[[File:Solar_Resource_Map_of_India.png|200px|Solar Resource in India]] | ||
| + | |[[File:Sachin Tendulkar cricket centuries against countries.JPG|thumb|150x150px]] | ||
| + | | style="width: 40%;" | | ||
| + | #Look at these examples of data representation with your teacher. | ||
| + | #In small groups, discuss what are the various kinds of analysis you can make from these examples of data. | ||
| + | #For each one your teacher will help you analyze in the form of a concept map. | ||
| + | |} | ||
| + | |||
| + | ====Student activities==== | ||
| + | #On each of the computers, you will find folders with different data sets. | ||
| + | #Each group of students will get one data set to work with - this will comprise maps, satellite images, pictographs and bar graphs. Your teacher will also give you a set of questions for each data set. | ||
| + | ##Make a concept map of what you understand with the data | ||
| + | ##You can also add your findings in a text document, using [[Learn LibreOffice Writer|LibreOffice Writer]]. You can enter text in both Kannada and in English | ||
| + | '''Rainfall''' | ||
| + | {| class="wikitable" | ||
| + | |- | ||
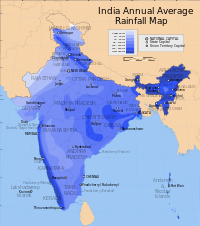
| + | | style="width: 25%;" |[[File:India_annual_rainfall_map_en.svg|200px|India annual rainfall]] | ||
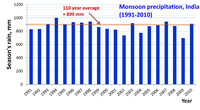
| + | | style="width: 25%;" |[[File:1991_to_2010_rainfall_totals_during_monsoon_India.png|200px|Rainfall totals]] | ||
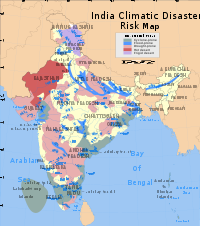
| + | | style="width: 25%;" |[[File:India_climatic_disaster_risk_map_en.svg|200px|India climatic disaster]] | ||
| + | | style="width: 25%;" |[[File:Western_Disturbance_-_3_February_2013.jpg|200px|Satellite image of rain clouds]] | ||
| + | |} | ||
| + | '''India's forests''' | ||
| + | {| class="wikitable" | ||
| + | | style="width: 25%;" |[[File:Andhra_Pradesh_and_Telangana_Physical.jpeg|200px|Topography Telangana and AP]] | ||
| + | | style="width: 25%;" |[[File:Indian_Forest_Cover.png|200px|Indian Forest Cover]] | ||
| + | | style="width: 25%;" |[[File:TSforestcover.png|200px|Telangana Forest Cover]] | ||
| + | | style="width: 25%;" |[[File:AreaUnderWildlifeSanctuariesIndia2006.png|200px|Data on sanctuaries]] | ||
| + | |} | ||
| + | |||
| + | '''Map of Telangana''' | ||
| + | {| class="wikitable" | ||
| + | |- | ||
| + | | style="width: 25%;" |[[File:India 78.40398E 20.74980N.jpg|200px|India 78.40398E 20.74980N]] | ||
| + | | style="width: 25%;" |[[File:Political map of India EN.svg|200px|Political map of India EN]] | ||
| + | | style="width: 25%;" |[[File:India Telangana location map.svg|200px|India Telangana location map]] | ||
| + | | style="width: 25%;" |[[File:Telangana new districts 2016.jpg|200px|Telangana new districts 2016]] | ||
| + | |} | ||
| + | |||
| + | '''Story of Godavari''' | ||
| + | {| class="wikitable" | ||
| + | |- | ||
| + | | style="width: 25%;" |[[File:Rivers and lakes topo map.png|200px|Rivers and lakes topo map]] | ||
| + | | style="width: 25%;" |[[File:Sri Ram Sagar Project (Pochampahad).jpg|200px|Sri Ram Sagar Project (Pochampahad)]] | ||
| + | | style="width: 25%;" |[[File:Godavaribasin.png|200px|Godavaribasin]] | ||
| + | | style="width: 25%;" |[[File:Krishna godavari delta region.png|200px|Krishna godavari delta region]] | ||
| + | |} | ||
| + | |||
| + | '''Pictographs-qualitative''' | ||
| + | {| class="wikitable" | ||
| + | |- | ||
| + | | style="width: 25%;" |[[File:National_Park_Service_sample_pictographs.svg|200px|Park Safety symbols]] | ||
| + | | style="width: 25%;" |[[File:NEWSPAPER_ROCK_IS_A_LARGE_CLIFF_MURAL_OF_ANCIENT_INDIAN_PETROGLYPHS_AND_PICTOGRAPHS,_REMARKABLE_FOR_THE_CLARITY_OF..._-_NARA_-_545671.jpg|200px|One of the first ICT]] | ||
| + | | style="width: 25%;" |[[File:Delhi_metro_rail_network.svg|200px|A picture to guide you on the train]] | ||
| + | | style="width: 25%;" |[[File:Timeline_evolution_of_life.svg|200px|The story of life]] | ||
| + | |} | ||
| + | |||
| + | '''Pictographs-quantitative''' | ||
| + | {| class="wikitable" | ||
| + | |- | ||
| + | | style="width: 50%;" |[[File:Pictograph access to water.png|425px|Pictograph access to water]] | ||
| + | | style="width: 25%;" |[[File:Pictograph visitor transport.png|220px|Pictograph visitor transport]] | ||
| + | | style="width: 25%;" |[[File:Pictograph why do-people travel.png|220px|Pictograph why do-people travel]] | ||
| + | |} | ||
| − | + | {| class="wikitable" | |
| − | |||
| − | {|class="wikitable" | ||
|- | |- | ||
| − | | | + | | style="width: 50%;" |[[File:Pictograph tourist spend.png|150px|Pictograph tourist spend]] |
| − | | | + | | style="width: 50%;" |[[File:Keyforpictograph.png|200px|Keyforpictograph]] |
| − | |||
| − | |||
| − | |||
|} | |} | ||
| − | == | + | ===Portfolio=== |
| − | # | + | #Make a concept map, as shown by your teacher, to share your findings: |
| − | # | + | ##What is the data about? |
| − | # | + | ##How was the data represented? |
| + | ##What was special about each representation? | ||
| + | ##What did you conclude from the data? | ||
| + | ##Have you studied about this before? | ||
| + | ##What more do you want to know? | ||
| + | #For the pictographs, make a concept map to share your understanding of the data you studied. | ||
| + | #Once the concept map has been developed on a paper, with the help of your teacher, [https://www.merriam-webster.com/dictionary/digitize digitize] it and save it in your folder. | ||
| − | + | [[Category:Level 1]] | |
| − | + | [[Category:Data representation and processing]] | |
Latest revision as of 10:53, 26 November 2019
Data can tell stories
In this activity, you will learn to see different formats of data and try to interpret the data.
Data can tell stories
Objectives
- Understanding that data can be in different formats
- Reading different kinds of data to make meaning
- Analyzing data and expressing
What prior skills are assumed
- Creating folders and saving files
- Opening a given file with the correct application
- Familiarity with using a key board
What resources do you need
- Working computer lab with projector
- Computers installed with Ubuntu Operating System
- Access to internet
- Data in the form of bar graphs, pictographs, maps (images)
- Handout for Ubuntu
- Handout for Tux Typing
- Handout for LibreOffice Writer
- Handout for Freeplane
What digital skills will you learn
- Creating and navigating folders (and sub-folders)
- Opening multiple files with multiple applications
- Text entry (local languages)
Description of activity with detailed steps
Teacher led activity
Student activities
- On each of the computers, you will find folders with different data sets.
- Each group of students will get one data set to work with - this will comprise maps, satellite images, pictographs and bar graphs. Your teacher will also give you a set of questions for each data set.
- Make a concept map of what you understand with the data
- You can also add your findings in a text document, using LibreOffice Writer. You can enter text in both Kannada and in English
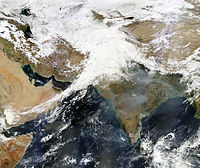
Rainfall
|
|
|
|
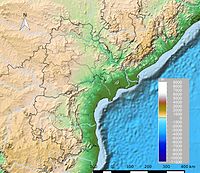
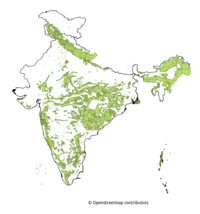
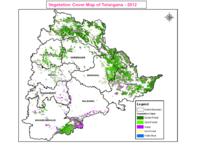
India's forests
|
|
|
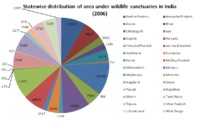
|
Map of Telangana

|

|

|

|
Story of Godavari

|

|
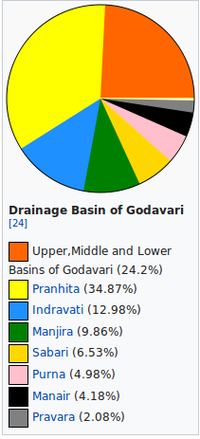
|

|
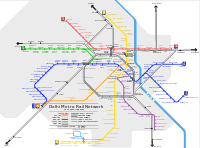
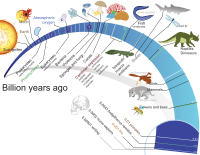
Pictographs-qualitative
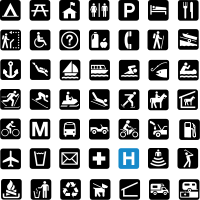
|
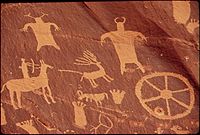
|
|
|
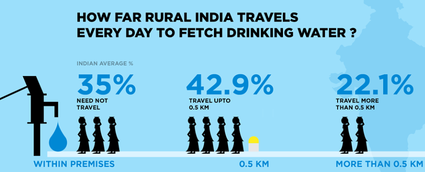
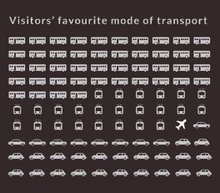
Pictographs-quantitative
|
|
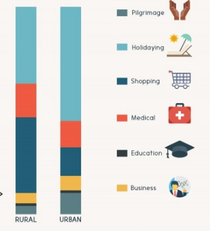
|
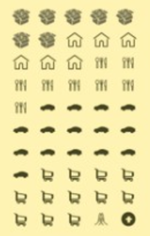
|
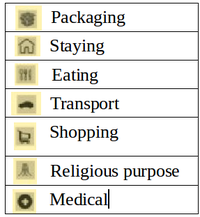
|
Portfolio
- Make a concept map, as shown by your teacher, to share your findings:
- What is the data about?
- How was the data represented?
- What was special about each representation?
- What did you conclude from the data?
- Have you studied about this before?
- What more do you want to know?
- For the pictographs, make a concept map to share your understanding of the data you studied.
- Once the concept map has been developed on a paper, with the help of your teacher, digitize it and save it in your folder.


