Difference between revisions of "ICT student textbook/Data representation and processing"
| (16 intermediate revisions by 3 users not shown) | |||
| Line 1: | Line 1: | ||
| − | {{Navigate|Prev=What | + | [http://karnatakaeducation.org.in/KOER/index.php/ಐಸಿಟಿ_ವಿದ್ಯಾರ್ಥಿ_ಪಠ್ಯ/ದತ್ತಾಂಶದ_ಪ್ರಾತಿನಿಧ್ಯ_ಮತ್ತು_ಪ್ರಕ್ರಿಯೆ ಕನ್ನಡ]{{Navigate|Prev=What is the nature of ICT|Curr=Data representation and processing|Next=Communication with graphics}} |
===What is this unit about=== | ===What is this unit about=== | ||
| − | If someone asks you | + | If someone asks you what is data, what would your answer be? Read the following sentences and if you agree, put a tick mark. Add other things you do in which you gather data. |
| + | {| class="wikitable" | ||
| + | |- | ||
| + | | style="width: 10%;" |[[File:Emojione 1F4DD.svg|left|thumb|100x100px]] | ||
| + | | style="width: 90%;" | | ||
| + | #You gather data when you see. | ||
| + | #You gather data when you read. | ||
| + | #You gather data when you are watching TV. | ||
| + | #You gather data when you cook or when you eat. | ||
| + | #You gather data when you play | ||
| + | #You gather data when ______________________ | ||
| + | #You gather data when ______________________ | ||
| + | #You gather data when ______________________ | ||
| + | |} | ||
| + | Gathering data from the environment, analyzing and understanding and decision making are important for survival. Imagine human beings hunting and roaming in the forests - if they see a wolf, they should process the data and quickly run for cover. So, gathering data and using it for decision making is not new for human beings. | ||
| − | + | Can you guess what may be different about this unit? Yes - you are correct! Digital technologies have changed the way we are gathering data and representing data. Discuss with your friends, in groups, all the word that come to your mind when you say data. | |
| + | Now look at the following and identify whether the following are data or not. | ||
| + | |||
| + | <gallery mode="packed" heights="150px" style="text-align:left"> | ||
| + | File:Mass Balance Change over India from GRACE.ogv | ||
| + | File:Double rainbow, Graz, Austria, 2010-05-30.jpg | ||
| + | File:Magic_Square_2015.jpeg | ||
| + | File:Rain and thunder (01).ogg | ||
| + | </gallery> | ||
| + | |||
| + | <gallery mode="packed" heights="150px" style="text-align:left"> | ||
| + | File:8-cell-simple.gif | ||
| + | File:Sachin_Tendulkar_cricket_centuries_against_countries.JPG | ||
| + | File:Anandam_by_Dasari_Venkataramana_cover.jpg | ||
| + | {{Youtube|WVuV_xVDJDY}} | ||
| + | </gallery> | ||
{| class="wikitable" | {| class="wikitable" | ||
| − | |||
| − | |||
| − | |||
| − | |||
|- | |- | ||
| − | | | + | | |
| − | + | {| | |
| − | | | + | ![[File:Mass Balance Change over India from GRACE.ogv|150px|Mass Balance Change over India from GRACE|link=http://119.226.159.19/OER/index.php/File:Mass_Balance_Change_over_India_from_GRACE.ogv]] |
| − | |||
|} | |} | ||
| − | + | | | |
| − | + | {| class="wikitable" | |
| − | + | ![[File:Double rainbow, Graz, Austria, 2010-05-30.jpg|150px|Double rainbow, Graz, Austria]] | |
| + | |} | ||
| + | |[[File:Magic_Square_2015.jpeg|150px]] | ||
| + | | | ||
| + | {| class="wikitable" | ||
| + | ![[File:Rain and thunder (01).ogg|150x150px|Rain and thunder]] | ||
| + | |} | ||
| + | |- | ||
| + | |{{Youtube|WVuV_xVDJDY}} | ||
| + | | | ||
{| class="wikitable" | {| class="wikitable" | ||
| − | + | |- | |
| − | [[File: | + | |[[File:8-cell-simple.gif|center|150px|A 3D projection animation]] |
| − | + | |} | |
| − | [[File: | + | |[[File:Sachin_Tendulkar_cricket_centuries_against_countries.JPG|150px|Sachin_Tendulkar_cricket_centuries_against_countries.JPG]] |
| − | + | |[[File:Anandam_by_Dasari_Venkataramana_cover.jpg|150px]] | |
|} | |} | ||
| − | + | Are you surprised? All the above are data. We saw how computers work by converting everything into data. Whether we see a picture, or listen to a song or perform calculations, we are working with data. In today's world data is becoming more and more important and we should develop skills of understanding data to make decisions. | |
| + | |||
===Objectives=== | ===Objectives=== | ||
| − | # Understanding how to read data in various formats | + | # Understanding how to read data in various formats and analyze |
# Understanding methods of data organizing, analysis and representation | # Understanding methods of data organizing, analysis and representation | ||
# Processing and representing data in textual, image and numeric formats with different tools | # Processing and representing data in textual, image and numeric formats with different tools | ||
| Line 35: | Line 69: | ||
=== How is this unit organized === | === How is this unit organized === | ||
| − | As in the previous unit, there are three levels of activities, | + | As in the previous unit, there are three levels of activities, for classes 6,7 and 8 respectively. This is the first unit in which you will be interacting with different ICT applications and will be getting introduced to [[Learn Ubuntu|basic digital literacy]]. In this unit, one of the first things you will learn is to type in the local language. |
# At the first level, the focus will be on reading data in different formats, organizing data, analysing and making meaning. You will be introduced to concept mapping and text editing as a method of documenting your analysis. | # At the first level, the focus will be on reading data in different formats, organizing data, analysing and making meaning. You will be introduced to concept mapping and text editing as a method of documenting your analysis. | ||
# At the second level, you will learn to use spreadsheet for data collection, organizing and analysis. | # At the second level, you will learn to use spreadsheet for data collection, organizing and analysis. | ||
| − | # At the third level, which will be in the third year, you will be introduced to making multi-page | + | # At the third level, which will be in the third year, you will be introduced to making multi-page documents to communicate your ideas. |
At each level you will be exploring new things about ICT; you will also be creating your outputs and building your digital portfolio. This portfolio will include your outputs; they will be such that you will know what you have learnt and you will also know the method of learning. At the end of the year, your teacher will assess your portfolio. | At each level you will be exploring new things about ICT; you will also be creating your outputs and building your digital portfolio. This portfolio will include your outputs; they will be such that you will know what you have learnt and you will also know the method of learning. At the end of the year, your teacher will assess your portfolio. | ||
| − | The examples will be drawn from your textbook and will be related to different topics you have studied. | + | The examples will be drawn from your textbook and will be related to different topics you have studied. |
| + | |||
| + | The links to each of the units are provided below. | ||
| + | |||
| + | ==== [[ICT student textbook/Data representation and processing level 1|Level 1]] ==== | ||
| − | ==== [[ICT student textbook/Data representation and processing level | + | ==== [[ICT student textbook/Data representation and processing level 2|Level 2]] ==== |
| − | ==== [[ICT student textbook/Data representation and processing level | + | ==== [[ICT student textbook/Data representation and processing level 3|Level 3]] ==== |
| − | + | [[Category:Data representation and processing]] | |
| + | [[Category:Level]] | ||
Latest revision as of 16:46, 30 May 2019
What is this unit about
If someone asks you what is data, what would your answer be? Read the following sentences and if you agree, put a tick mark. Add other things you do in which you gather data.
|
Gathering data from the environment, analyzing and understanding and decision making are important for survival. Imagine human beings hunting and roaming in the forests - if they see a wolf, they should process the data and quickly run for cover. So, gathering data and using it for decision making is not new for human beings.
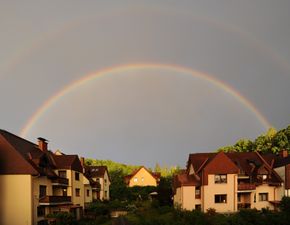
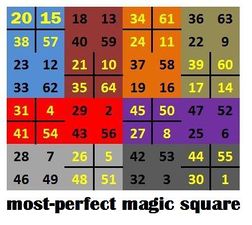
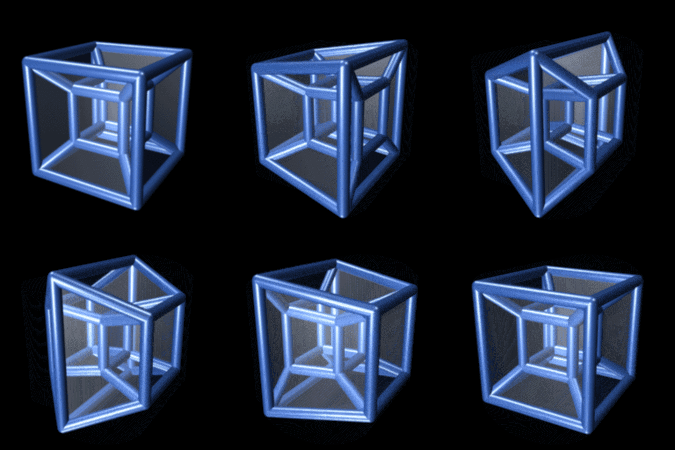
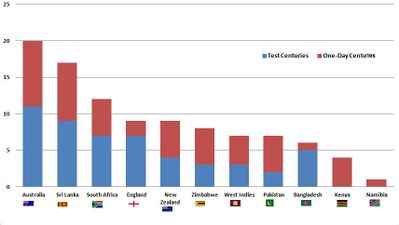
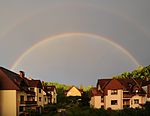
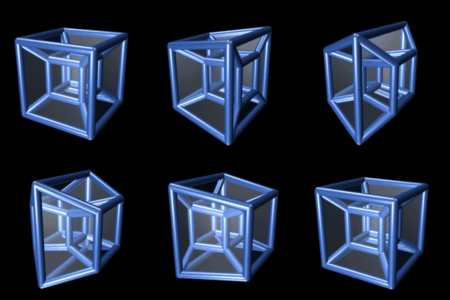
Can you guess what may be different about this unit? Yes - you are correct! Digital technologies have changed the way we are gathering data and representing data. Discuss with your friends, in groups, all the word that come to your mind when you say data. Now look at the following and identify whether the following are data or not.
|
|
|

|
| |||
|
|
|

|

|
Are you surprised? All the above are data. We saw how computers work by converting everything into data. Whether we see a picture, or listen to a song or perform calculations, we are working with data. In today's world data is becoming more and more important and we should develop skills of understanding data to make decisions.
Objectives
- Understanding how to read data in various formats and analyze
- Understanding methods of data organizing, analysis and representation
- Processing and representing data in textual, image and numeric formats with different tools
- Understanding the power of data visualization
How is this unit organized
As in the previous unit, there are three levels of activities, for classes 6,7 and 8 respectively. This is the first unit in which you will be interacting with different ICT applications and will be getting introduced to basic digital literacy. In this unit, one of the first things you will learn is to type in the local language.
- At the first level, the focus will be on reading data in different formats, organizing data, analysing and making meaning. You will be introduced to concept mapping and text editing as a method of documenting your analysis.
- At the second level, you will learn to use spreadsheet for data collection, organizing and analysis.
- At the third level, which will be in the third year, you will be introduced to making multi-page documents to communicate your ideas.
At each level you will be exploring new things about ICT; you will also be creating your outputs and building your digital portfolio. This portfolio will include your outputs; they will be such that you will know what you have learnt and you will also know the method of learning. At the end of the year, your teacher will assess your portfolio.
The examples will be drawn from your textbook and will be related to different topics you have studied.
The links to each of the units are provided below.
