Difference between revisions of "ICT student textbook/Data can tell stories"
Jump to navigation
Jump to search
| Line 1: | Line 1: | ||
{{Navigate|Prev=Data representation and processing level 1|Curr=Data can tell stories|Next=How to make data meaningful}} | {{Navigate|Prev=Data representation and processing level 1|Curr=Data can tell stories|Next=How to make data meaningful}} | ||
| − | |||
'''Data can tell stories''' | '''Data can tell stories''' | ||
<div class="noprint" style="float:right; border:1px solid blue;width:300px;background-color:#F5F5F5;padding:2px;"> | <div class="noprint" style="float:right; border:1px solid blue;width:300px;background-color:#F5F5F5;padding:2px;"> | ||
Revision as of 17:28, 15 October 2016
Data can tell stories
Objectives
- Understand that data can be in different formats
- Reading different kinds of data to make meaning
- Analyzing and expressing
What prior skills are assumed
- Creating folders and saving files
- Opening a given file with the correct application
- Familiarity with using a key board
Resources needed
Hardware, software, Files
- Data in the form of bar graphs, pictographs, maps (images)
- Computer lab with projection
- Access to internet
- Handout - Learn Ubuntu
- Handout - Learn LibreOffice Writer
Description of activity with detailed steps
Teacher led activity
|
|
Student activities
- Folders with different data sets will be shared on each computer
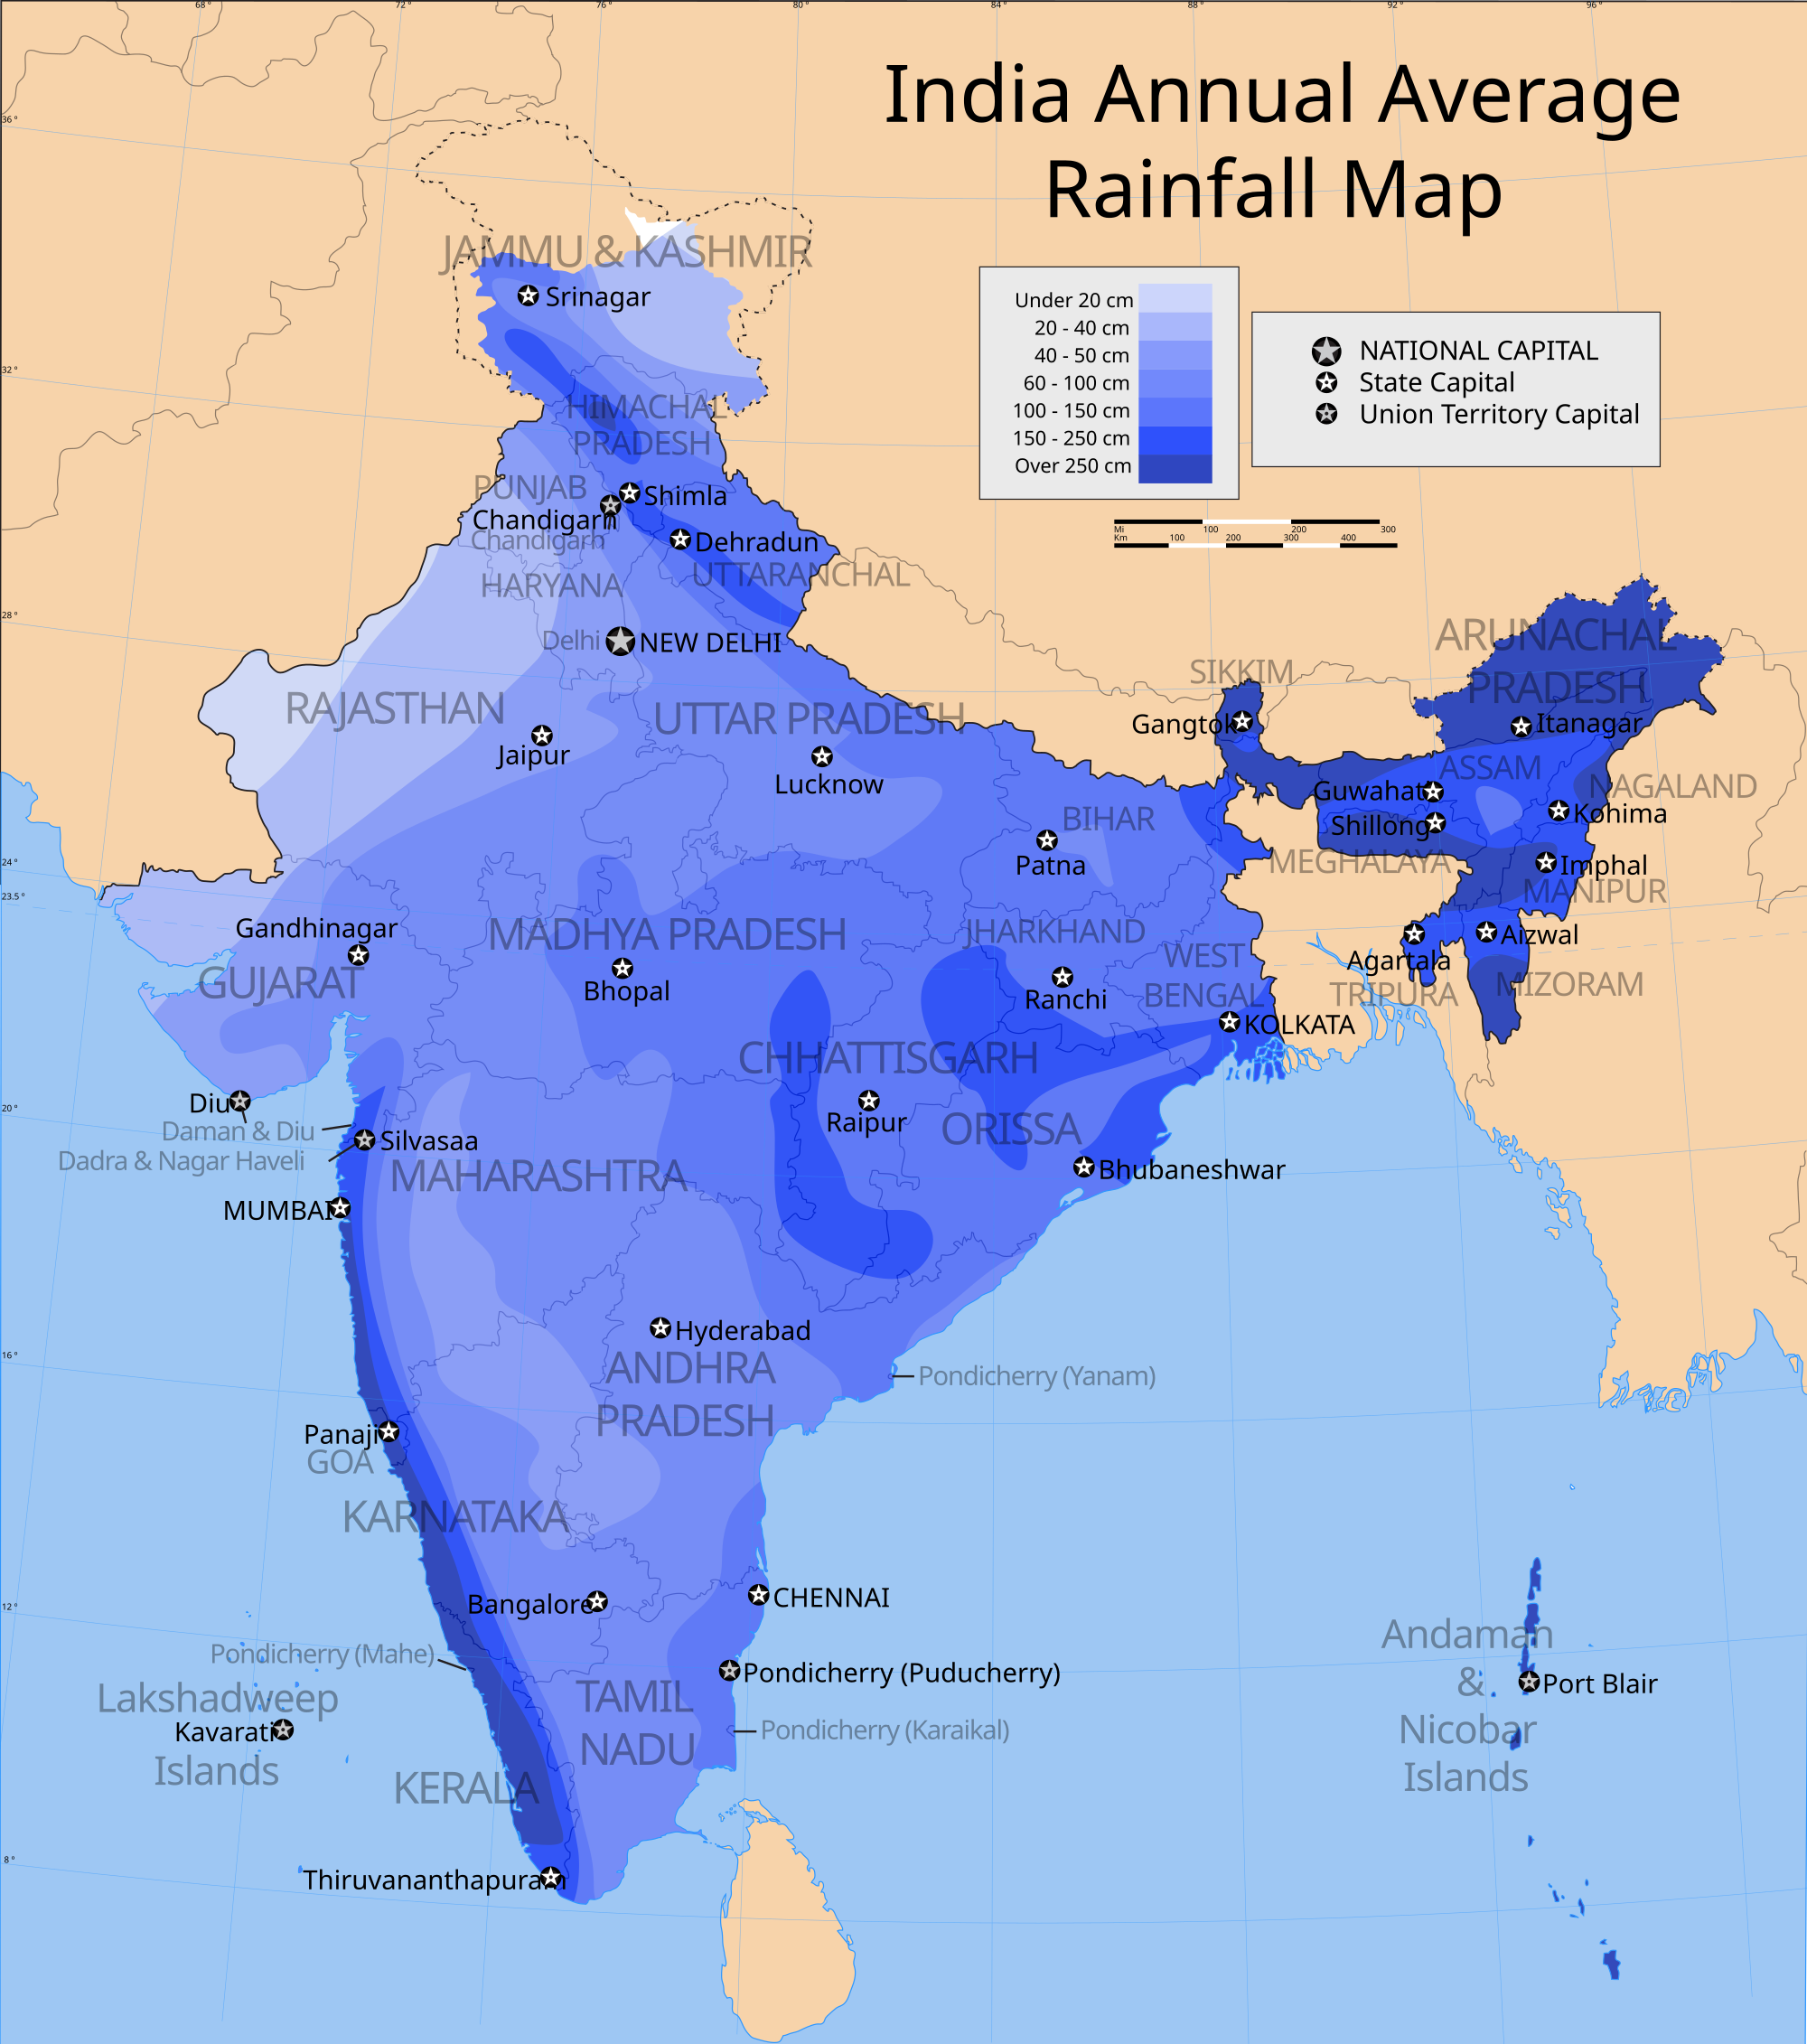
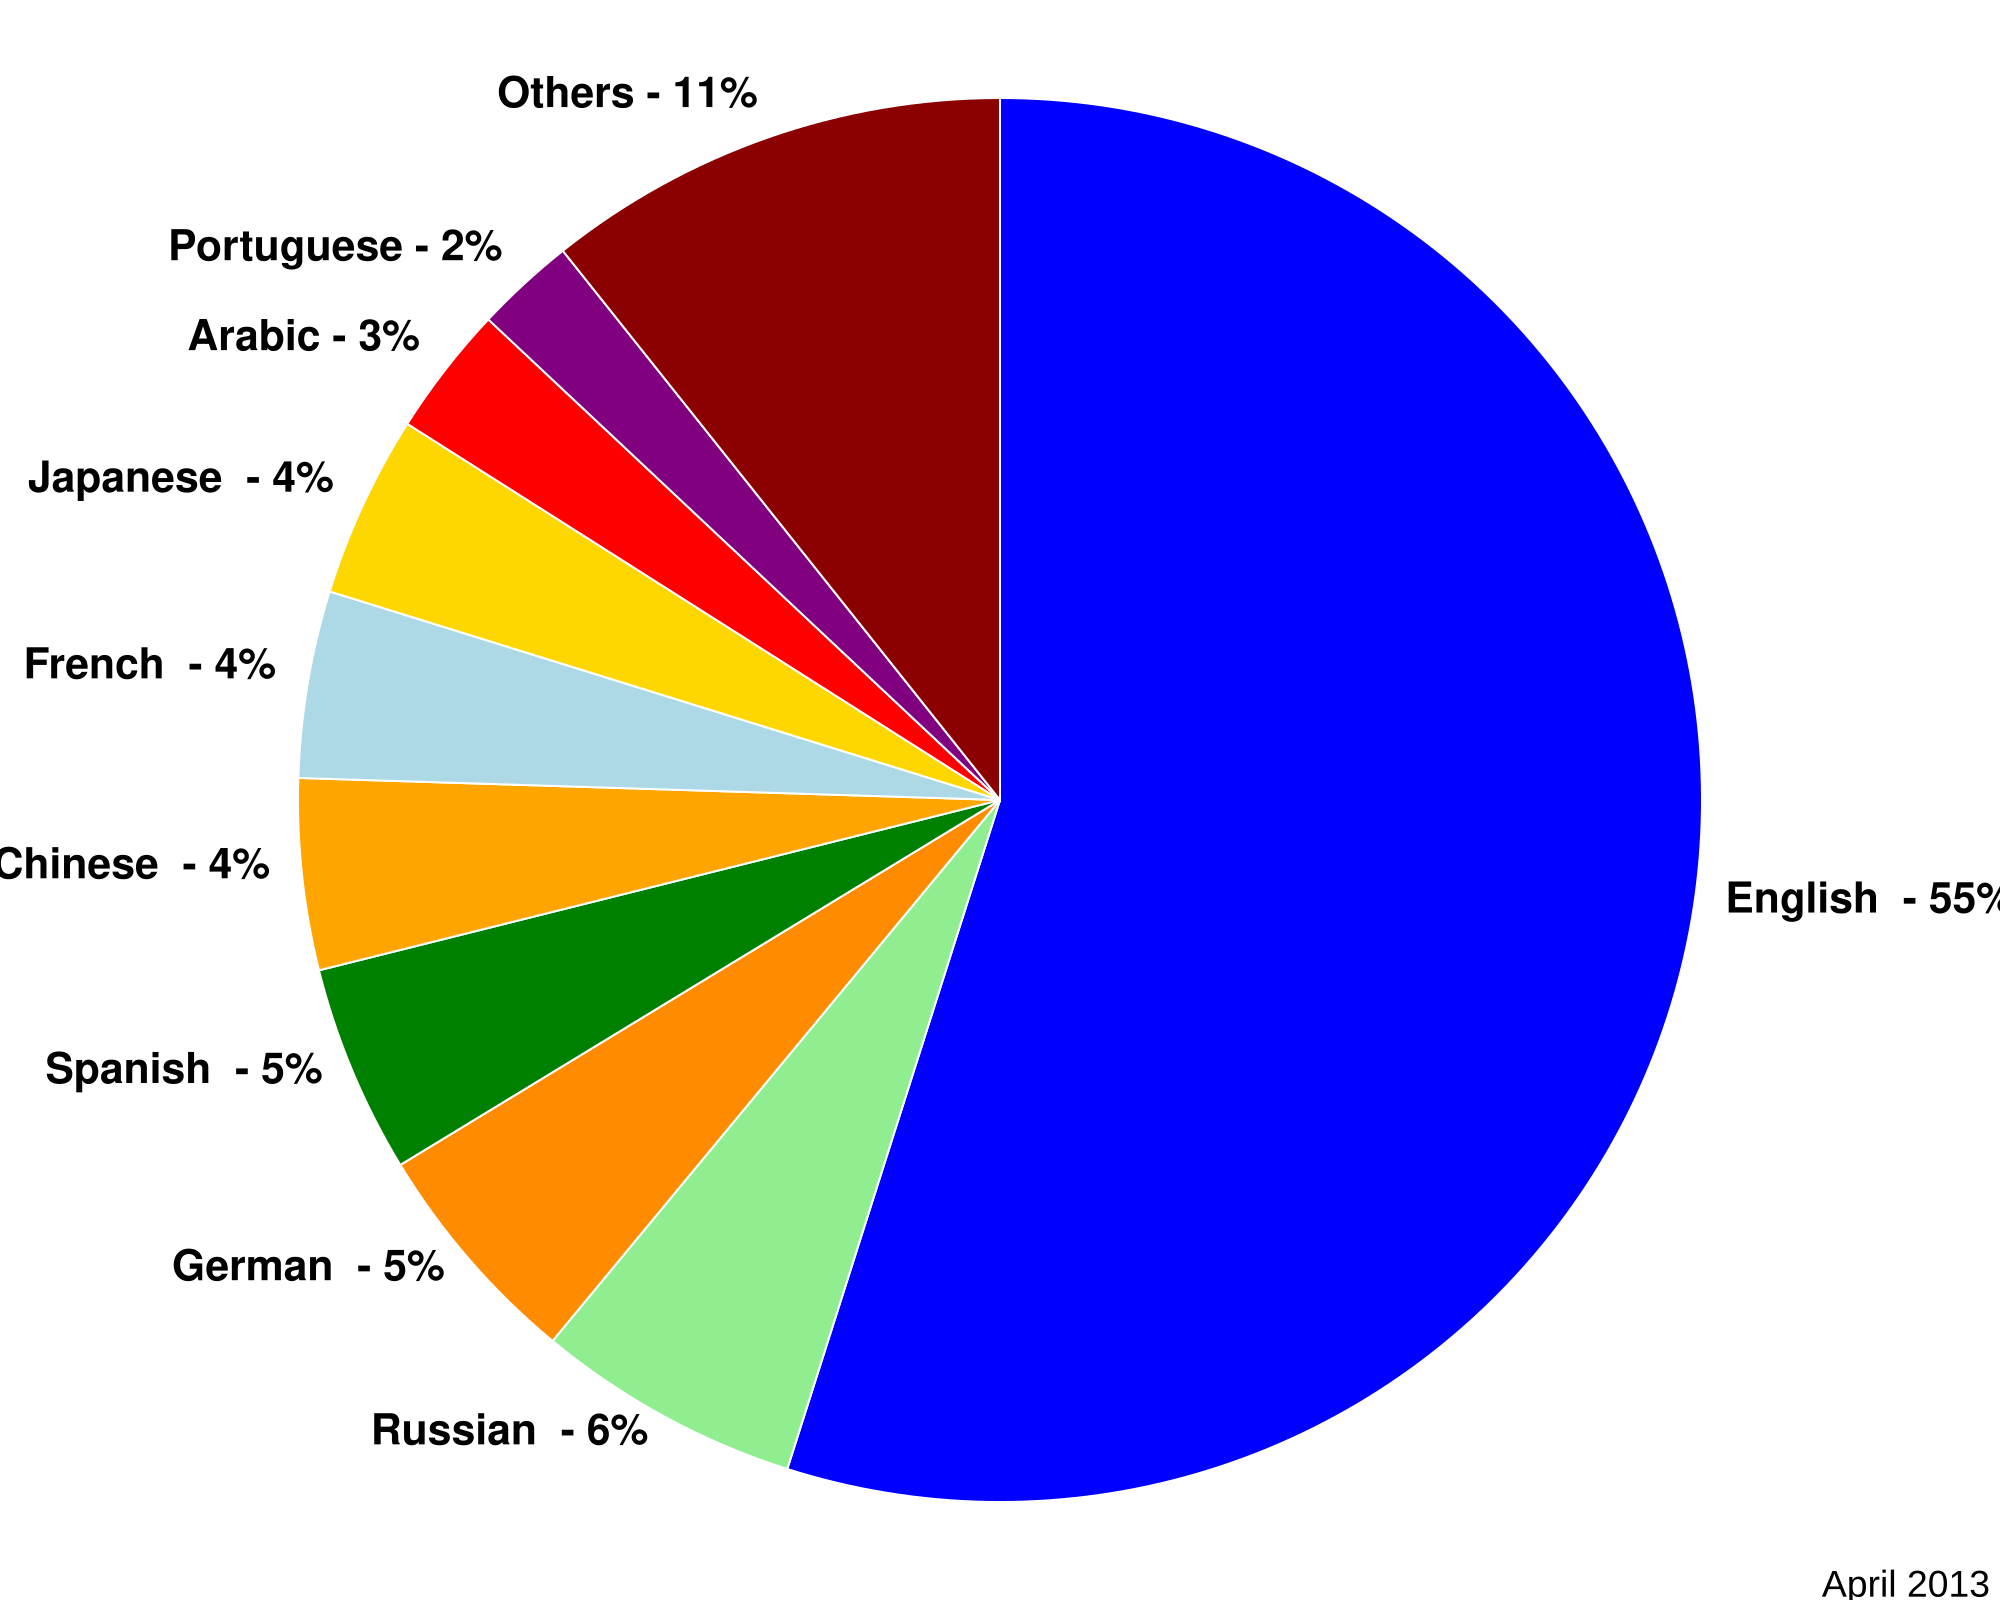
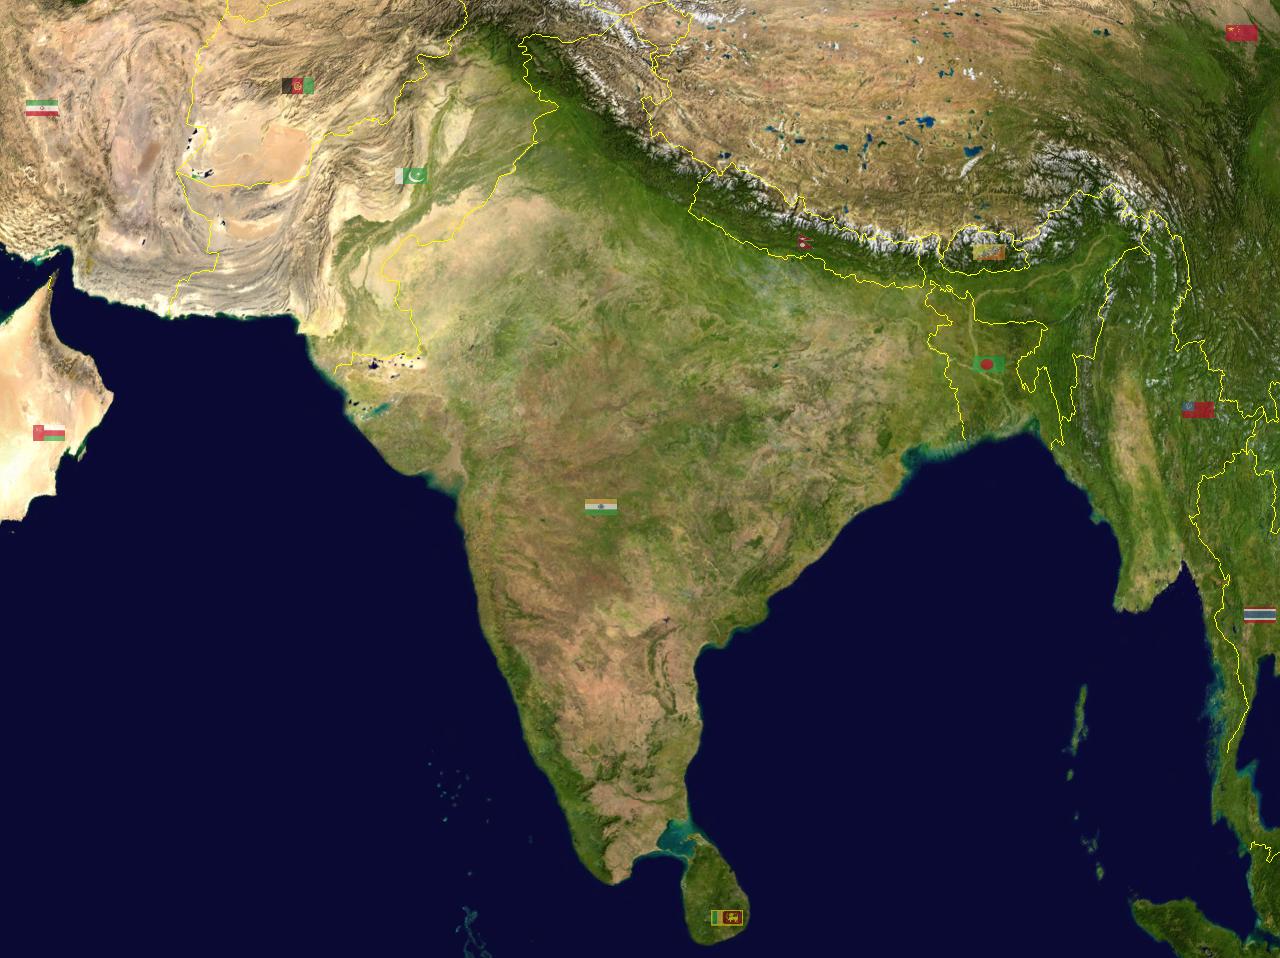
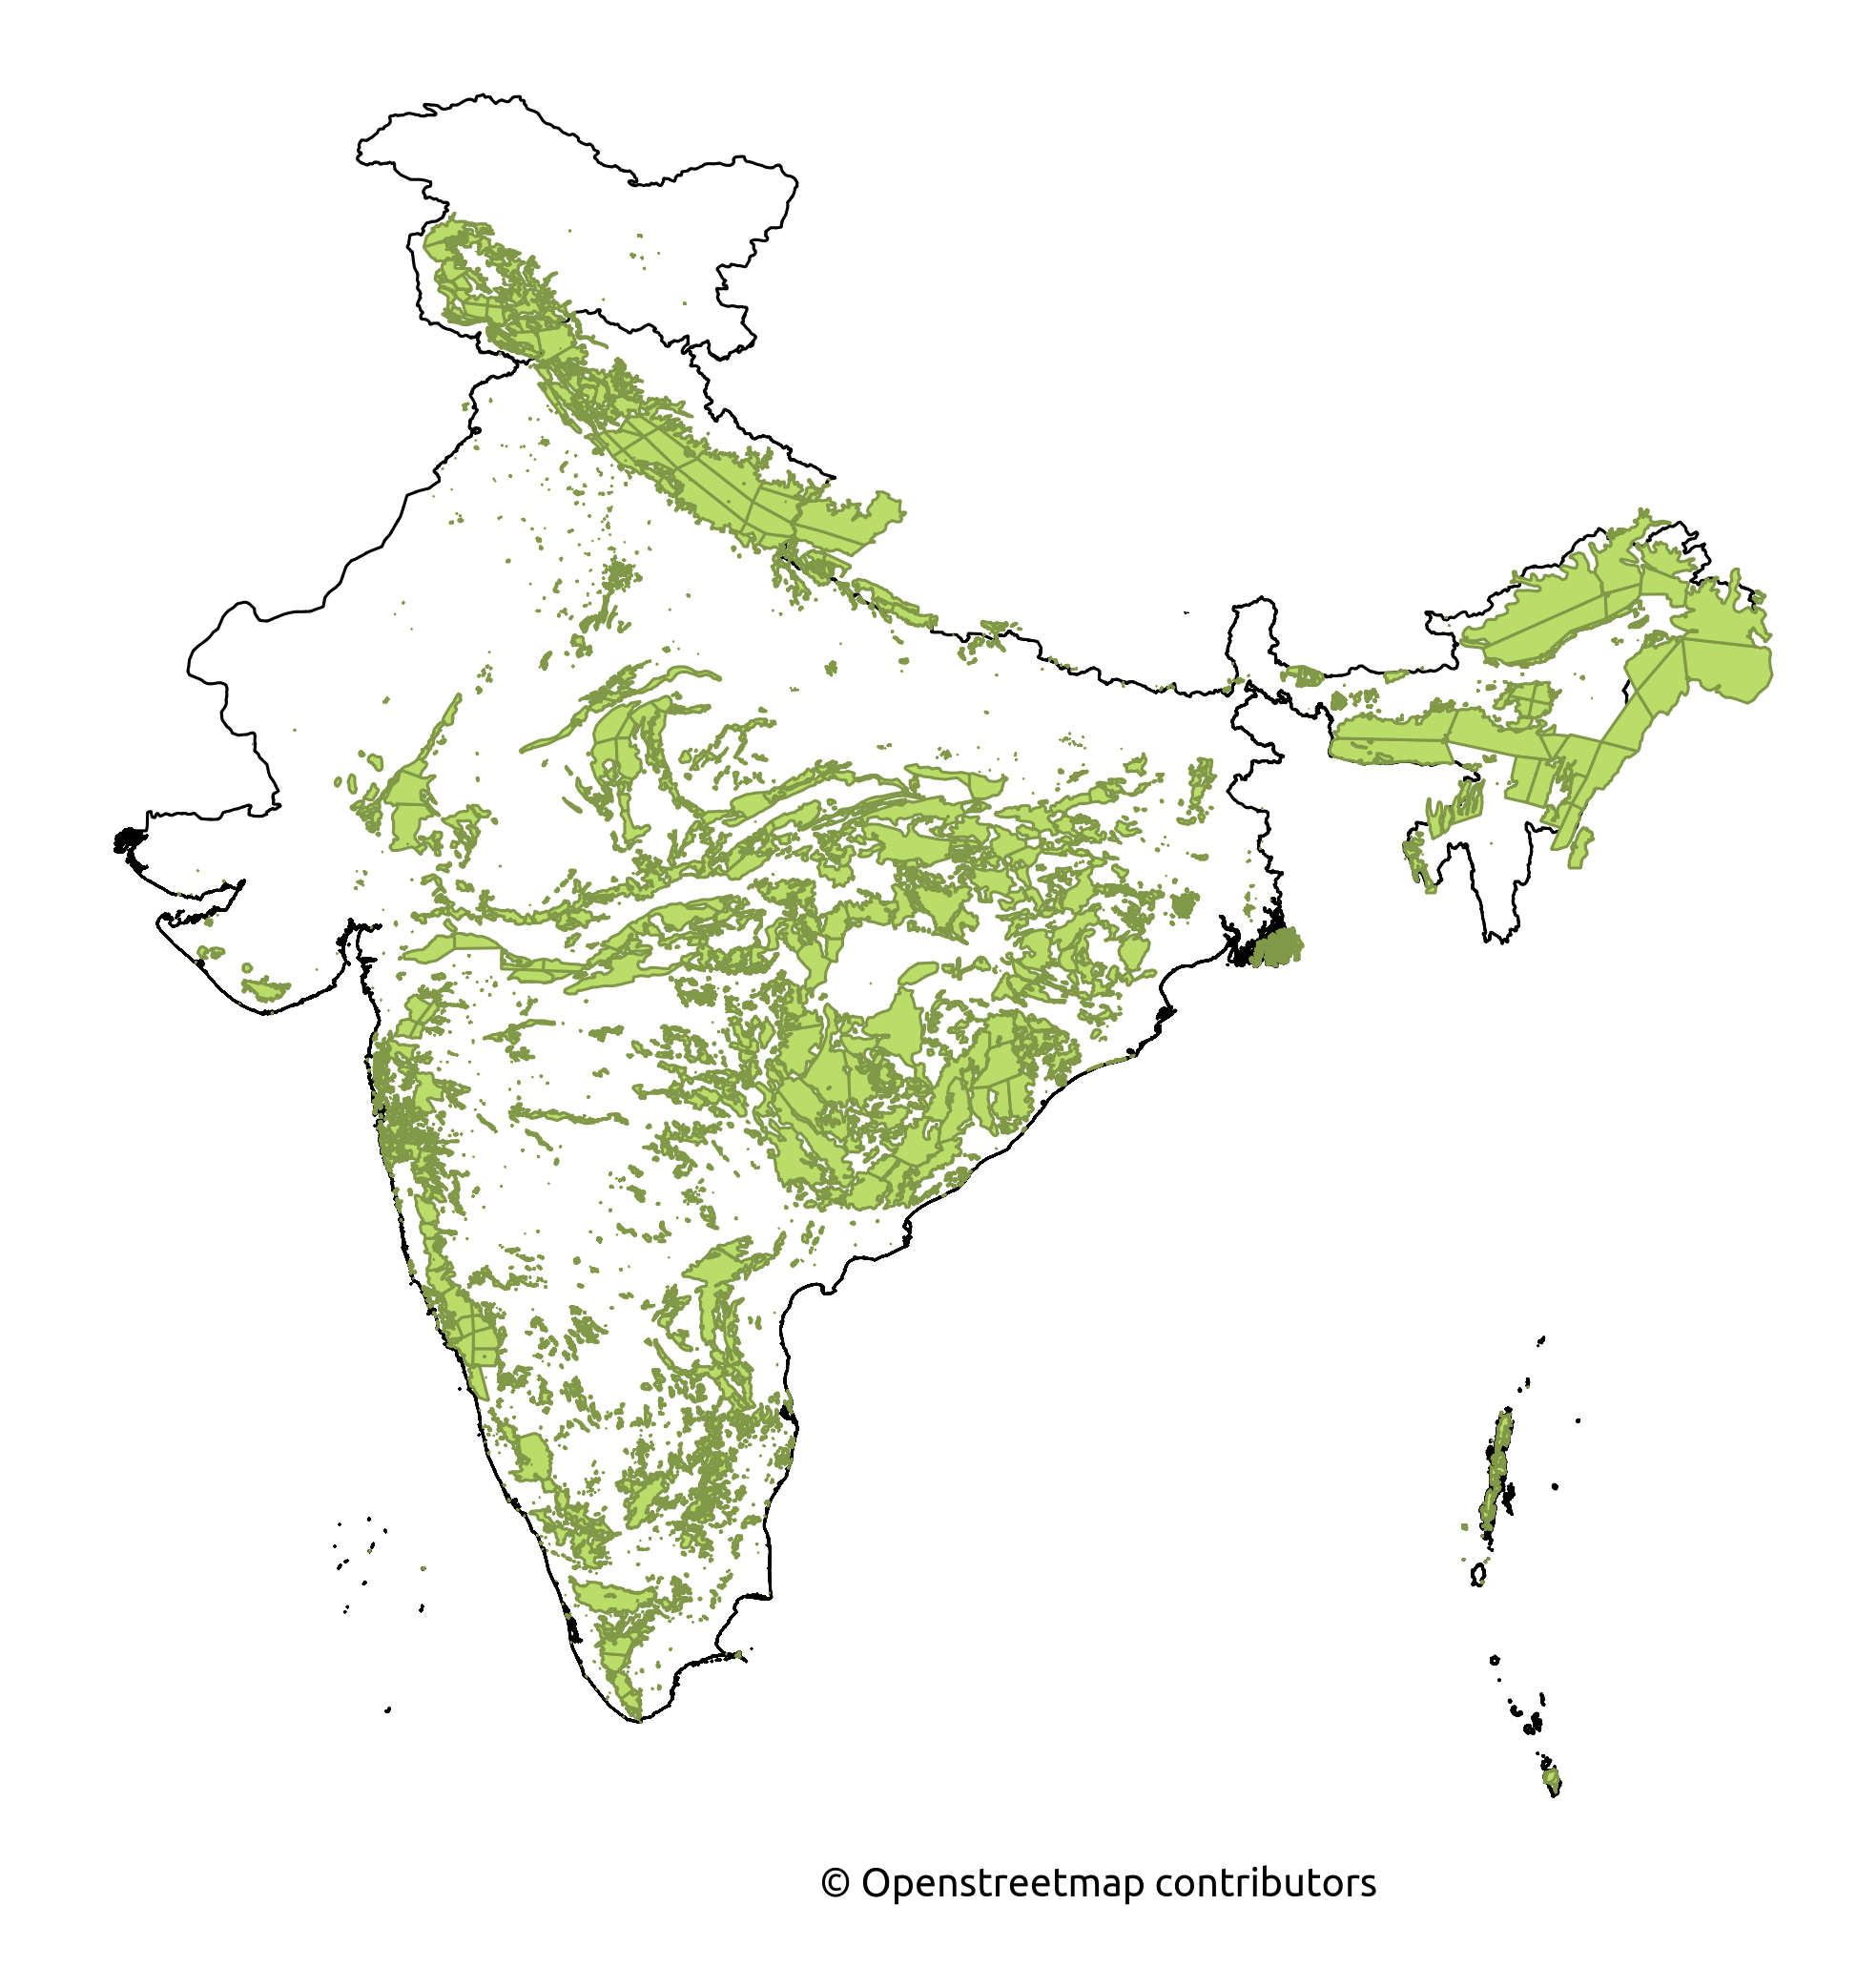
- Each group of students will get one data set to work with - this will comprise maps, satellite images, pictographs and bar graphs. Your teacher will also give you a set of questions for each data set.
- Data sets are given below:
| Data set 1 | |
| Data set 2 |
|
| Data set 3 |
|
| Data set 4 | More images |
- Summarize your findings in a text document
Portfolio
- Text document with analysis of data


