Difference between revisions of "ICT student textbook/Columns and rows!"
| Line 1: | Line 1: | ||
{{Navigate|Prev=Data representation and processing level 2|Curr=Columns and rows!|Next=Numbers and patterns}} | {{Navigate|Prev=Data representation and processing level 2|Curr=Columns and rows!|Next=Numbers and patterns}} | ||
| − | + | ||
<div class="noprint" style="float:right; border:1px solid blue;width:300px;background-color:#F5F5F5;padding:2px;"> | <div class="noprint" style="float:right; border:1px solid blue;width:300px;background-color:#F5F5F5;padding:2px;"> | ||
{| cellspacing="0" | {| cellspacing="0" | ||
| [[File:Book.jpg|none|80px|Book image]] | | [[File:Book.jpg|none|80px|Book image]] | ||
| − | | style="padding-left:2px;" | Go to <br /> [[ICT teacher handbook/Data_representation_and_processing|Teacher | + | | style="padding-left:2px;" | Go to <br /> [[ICT teacher handbook/Data_representation_and_processing|ICT Teacher Handbook]] |
|}</div> | |}</div> | ||
| + | <big><u>{{font color|brown|'''Learning to input and represent data using a spreadsheet'''}}</u></big> | ||
| + | |||
| + | {{font color|brown|In this activity, you will learn to input data in a spreadsheet and also represent data graphically.}} | ||
===Objectives=== | ===Objectives=== | ||
| − | #Learning data input with spreadsheet | + | #Learning data input with spreadsheet |
#Data analysis and summary with spreadsheets | #Data analysis and summary with spreadsheets | ||
| − | #Make plots and charts | + | #Make [[wikipedia:Plot_(graphics)|plots]] and [[wikipedia:Chart|charts]] |
===What prior skills are assumed=== | ===What prior skills are assumed=== | ||
#Familiarity with ICT environment | #Familiarity with ICT environment | ||
#Understanding of data organization | #Understanding of data organization | ||
| − | #Keyboard input | + | #Keyboard input (text editing) |
| − | === | + | ===What resources do you need === |
#Computer lab with projection equipment | #Computer lab with projection equipment | ||
#Student generated data sets | #Student generated data sets | ||
| Line 22: | Line 25: | ||
#Handout for [[Learn LibreOffice Calc|LibreOffice Calc]] | #Handout for [[Learn LibreOffice Calc|LibreOffice Calc]] | ||
#Handout for [[Learn LibreOffice Writer|LibreOffice Writer]] | #Handout for [[Learn LibreOffice Writer|LibreOffice Writer]] | ||
| − | === | + | ===What digital skills will you learn=== |
#[[Learn LibreOffice Calc|Working with spreadsheets]] | #[[Learn LibreOffice Calc|Working with spreadsheets]] | ||
| − | #[[Learn LibreOffice Calc| | + | #[[Learn LibreOffice Calc|Drawing plots and graphs]] |
===Description of activity with detailed steps=== | ===Description of activity with detailed steps=== | ||
| + | There are two parts of this activity. The first part is to get familiar with entering data in a spreadsheet. The second part is to learn how to analyse data from a spreadsheet, using secondary data sets. | ||
====Teacher led activity==== | ====Teacher led activity==== | ||
| + | '''''Getting familiar with spreadsheet''''' | ||
#Your teacher will demonstrate input of data with spreadsheet | #Your teacher will demonstrate input of data with spreadsheet | ||
#Discuss with your teacher what meaningful measures of data can be calculated | #Discuss with your teacher what meaningful measures of data can be calculated | ||
| − | #Your teacher will plot different graphs and discuss how different kinds of graphs can be meaningful | + | #Your teacher will show you the following in a spreadsheet: |
| − | + | ##Opening LibreOffice Calc and demonstrating how to create a new spreadsheet | |
| + | ##Entering data in a spreadsheet - typing in Telugu and English | ||
| + | ##Sorting (alphabetically or numerically) the data | ||
| + | ##Simple formatting in a spreadsheet - coloring of cells, making bold, cell borders | ||
| + | ##Entering simple formulae in a spreadsheet to calculate data; some of the formula to be calculated include total, percentage, minimum, maximum | ||
| + | ##Drawing charts - bar graphs and pie charts - in a spreadsheet | ||
| + | ##Copying the table of data entered and inserting into a text document | ||
| + | ##Inserting the graphs and charts entered into a text document | ||
| + | #Your teacher will plot different graphs and discuss how different kinds of graphs can be meaningful. Look at the graphs shown here and determine the advantage of each. | ||
| + | #Your teacher will also discuss with you what is the difference between the data set in the first and second example. | ||
| + | |||
| + | '''Example 1''' | ||
| + | <gallery mode="packed" heights="180px"> | ||
| + | File:samplespreadsheetdata.png | ||
| + | File:sampledataspreadsheet2.png | ||
| + | File:chart1.png | ||
| + | File:chart2.png | ||
| + | </gallery> | ||
| + | |||
| + | '''Example 2''' | ||
| + | <gallery mode="packed" heights="200px" style="text-align:left"> | ||
| + | File:sampledata3.png | ||
| + | File:chart3.png | ||
| + | </gallery> | ||
| + | |||
| + | '''Example 3''' | ||
| + | |||
| + | [[File:Fluorosis-in-India-top-10-indian-states-most-number-of-people-affected-Infographic.png|400px|Fluorosis-in-India]] | ||
| + | |||
====Student activities==== | ====Student activities==== | ||
| + | ===== ''<u>Tabulating data from a pictograph:</u>'' ===== | ||
| + | Look at the following data sets captured and tabulate in a spreadsheet. Plot the graph that will make meaning to the data. | ||
| + | |||
| + | <gallery mode="packed" heights="150px"> | ||
| + | File:Marksofstudents.jpg|Grades of students | ||
| + | File:Collectionbyday.jpg|Coin collection by day | ||
| + | File:Pictograph access to water.png|Access to water | ||
| + | </gallery> | ||
| + | |||
| + | <gallery mode="packed" heights="200px"> | ||
| + | File:Pictograph.jpg|Pictograph | ||
| + | File:Pictograph visitor transport.png|How people travel | ||
| + | File:Pictograph tourist spend.png|How do tourists spend | ||
| + | File:Keyforpictograph.png|Key for pictograph | ||
| + | </gallery> | ||
| + | |||
| + | ===== ''<u>Entering given numeric data in a spreadsheet:</u>'' ===== | ||
| + | Look at the following data sets captured and tabulate in a spreadsheet. Plot the graph that will make meaning to the data. It could be a bar chart or a pie chart. You can see that spreadsheet offers many other types of charts. You should explore these charts for your given table of data and try to understand what they say. | ||
| + | |||
| + | <gallery mode="packed" heights="180px"> | ||
| + | File:Indias population by Religion Census 2011 factly.png|India's population by religion | ||
| + | File:Indias-share-in-worlds-Spices-Production Infographic.png|India's share in world's spices production | ||
| + | File:Revenue-from-Entry-Fee-Top-8-Indian-Monuments-Factly.in .jpg|Revenue from Entry Fee from Top 8 Indian Monuments | ||
| + | </gallery> | ||
| + | |||
| + | <gallery mode="packed" heights="200px"> | ||
| + | File:India-School-Enrollment-Statistics-Enrollment-in-Government-Schools-2013-2014-Infographic.png|India School Enrollment Statistics | ||
| + | File:Top-10-Busiest-Airports-in-India-Infographic.png|Top 10 Busiest Airports in India | ||
| + | File:Who-is-in-Power-May-2016-2.jpg|Who is in power | ||
| + | </gallery> | ||
| + | |||
| + | ===== ''<u>Tabulating collected data from previous activity on organizing data</u>'' ===== | ||
| + | In the previous activity on [[ICT student textbook/How to make data meaningful|organizing data]] you had collected the data on various kinds of projects. You had also created a concept map and a text document describing your data collection and processing. As a part of this unit, you should enter the data you collected in a spreadsheet, sort, format and also calculate some simple measures of data. You should also add a pictorial or graphical representation of the data. | ||
| + | |||
| + | In the previous activity on [[ICT student textbook/Making a text document|organizing data]] you had created a text document with concept map and a written description. You can add the spreadsheet data into your document along with the charts. | ||
| + | |||
| + | ===Portfolio === | ||
| + | #You will add to your folder in this activity a new data format called spreadsheets. The spreadsheets you will create will be your digital portfolio. | ||
| + | #Cumulative text document with spreadsheet and chart(s) inserted. | ||
| − | + | [[Category:Level 2]] | |
| − | + | [[Category:Data representation and processing]] | |
| − | |||
Revision as of 06:27, 25 March 2017

Learning to input and represent data using a spreadsheet
In this activity, you will learn to input data in a spreadsheet and also represent data graphically.
Objectives
- Learning data input with spreadsheet
- Data analysis and summary with spreadsheets
- Make plots and charts
What prior skills are assumed
- Familiarity with ICT environment
- Understanding of data organization
- Keyboard input (text editing)
What resources do you need
- Computer lab with projection equipment
- Student generated data sets
- Secondary data sets
- Handout for LibreOffice Calc
- Handout for LibreOffice Writer
What digital skills will you learn
Description of activity with detailed steps
There are two parts of this activity. The first part is to get familiar with entering data in a spreadsheet. The second part is to learn how to analyse data from a spreadsheet, using secondary data sets.
Teacher led activity
Getting familiar with spreadsheet
- Your teacher will demonstrate input of data with spreadsheet
- Discuss with your teacher what meaningful measures of data can be calculated
- Your teacher will show you the following in a spreadsheet:
- Opening LibreOffice Calc and demonstrating how to create a new spreadsheet
- Entering data in a spreadsheet - typing in Telugu and English
- Sorting (alphabetically or numerically) the data
- Simple formatting in a spreadsheet - coloring of cells, making bold, cell borders
- Entering simple formulae in a spreadsheet to calculate data; some of the formula to be calculated include total, percentage, minimum, maximum
- Drawing charts - bar graphs and pie charts - in a spreadsheet
- Copying the table of data entered and inserting into a text document
- Inserting the graphs and charts entered into a text document
- Your teacher will plot different graphs and discuss how different kinds of graphs can be meaningful. Look at the graphs shown here and determine the advantage of each.
- Your teacher will also discuss with you what is the difference between the data set in the first and second example.
Example 1


Example 2


Example 3

Student activities
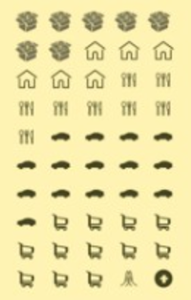
Tabulating data from a pictograph:
Look at the following data sets captured and tabulate in a spreadsheet. Plot the graph that will make meaning to the data.
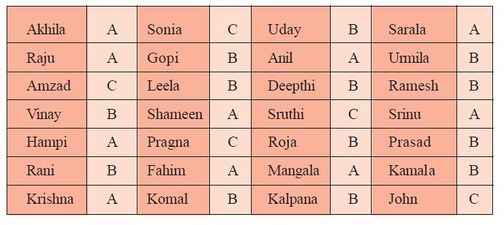
Grades of students

Coin collection by day

Access to water


Pictograph

How people travel
How do tourists spend

Key for pictograph


Entering given numeric data in a spreadsheet:
Look at the following data sets captured and tabulate in a spreadsheet. Plot the graph that will make meaning to the data. It could be a bar chart or a pie chart. You can see that spreadsheet offers many other types of charts. You should explore these charts for your given table of data and try to understand what they say.

India's population by religion

India's share in world's spices production

Revenue from Entry Fee from Top 8 Indian Monuments


India School Enrollment Statistics
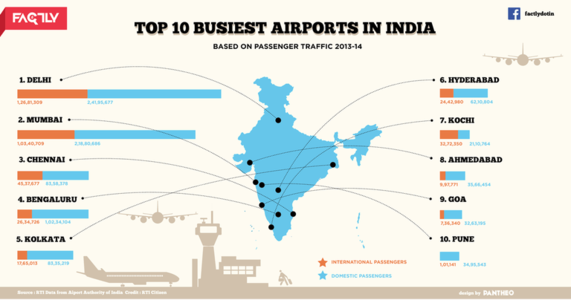
Top 10 Busiest Airports in India

Who is in power


Tabulating collected data from previous activity on organizing data
In the previous activity on organizing data you had collected the data on various kinds of projects. You had also created a concept map and a text document describing your data collection and processing. As a part of this unit, you should enter the data you collected in a spreadsheet, sort, format and also calculate some simple measures of data. You should also add a pictorial or graphical representation of the data.
In the previous activity on organizing data you had created a text document with concept map and a written description. You can add the spreadsheet data into your document along with the charts.
Portfolio
- You will add to your folder in this activity a new data format called spreadsheets. The spreadsheets you will create will be your digital portfolio.
- Cumulative text document with spreadsheet and chart(s) inserted.