Difference between revisions of "Geogebra Clix C01"
m (added Category:Mathematics using HotCat) |
|||
| (15 intermediate revisions by one other user not shown) | |||
| Line 1: | Line 1: | ||
| − | + | [[:File:C01 - Geogebra, April 2018.odt]] | |
| − | |||
| − | |||
| − | |||
| − | |||
| − | |||
| − | |||
| − | |||
| − | + | ===Getting familiar with the Geogebra interface=== | |
| − | + | ||
| + | |||
| + | [[File:Geogebra2a.png|Geogebra window|center|300px]] | ||
| − | |||
The above image shows you the Geogebra window. After opening Geogebra, you will see the application window as above. The user can define the graphics view in terms of the axes, the grid, scale of the axes, etc. The Move button - which allows objects to be moved is highlighted in blue. | The above image shows you the Geogebra window. After opening Geogebra, you will see the application window as above. The user can define the graphics view in terms of the axes, the grid, scale of the axes, etc. The Move button - which allows objects to be moved is highlighted in blue. | ||
| − | === | + | ===Tool bar introduction === |
In this section you will be introduced to the basic constructions available on the tool bar. | In this section you will be introduced to the basic constructions available on the tool bar. | ||
| − | |||
<gallery mode="packed" heights="250px" caption="Introduction to the tool bar"> | <gallery mode="packed" heights="250px" caption="Introduction to the tool bar"> | ||
File:Geogebra3.png|Moving objects | File:Geogebra3.png|Moving objects | ||
| Line 22: | Line 15: | ||
</gallery> | </gallery> | ||
<gallery mode="packed" heights="250px"> | <gallery mode="packed" heights="250px"> | ||
| − | + | ||
| − | |||
File:Geogebra_5_Construction_of_line.png|Drawing segments and lines | File:Geogebra_5_Construction_of_line.png|Drawing segments and lines | ||
| − | |||
| − | |||
File:Geogebra 6 Construction a parallel line.png|Drawing parallel lines | File:Geogebra 6 Construction a parallel line.png|Drawing parallel lines | ||
| − | |||
| − | |||
</gallery> | </gallery> | ||
| + | |||
The Geogebra tool bar is very versatile - the construction follows the processes that we would normally follow in paper and pen construction. Some six important categories in the tool bar are discussed below: | The Geogebra tool bar is very versatile - the construction follows the processes that we would normally follow in paper and pen construction. Some six important categories in the tool bar are discussed below: | ||
#Moving objects:Geogebra allows you to move object constructed freely by dragging the object. You can also select an object and move it by rotating aroung a point. | #Moving objects:Geogebra allows you to move object constructed freely by dragging the object. You can also select an object and move it by rotating aroung a point. | ||
| Line 36: | Line 25: | ||
#Drawing lines: The menu for lines and segments also allows multiple constructions - segments,lines, rays and vectors | #Drawing lines: The menu for lines and segments also allows multiple constructions - segments,lines, rays and vectors | ||
#Drawing multiple lines: Multiple lines can also be drawn in Geogebra. Parallel lines, perpendicular lines, angle bisectors and perpendicular bisectors can be drawn. | #Drawing multiple lines: Multiple lines can also be drawn in Geogebra. Parallel lines, perpendicular lines, angle bisectors and perpendicular bisectors can be drawn. | ||
| − | # | + | ====Saving and exporting==== |
| + | #You can save Geogebra file from the File menu. | ||
| + | #You can also export the Geogebra file as an image (.png format) or as an animated graphic (.gif format). | ||
| + | #If you export the Geogebra file as html you can publish it on the repository for Geogebra files. | ||
| − | === | + | ===Measuring an angle=== |
| − | <gallery mode="packed" heights="250px" caption=" | + | <gallery mode="packed" heights="250px" caption="Measuring an angle"> |
| − | File: | + | File:Geogebra_angle_measurement.png |
| − | + | File:Geogebra angle measure.png | |
| − | |||
| − | |||
| − | |||
| − | File:Geogebra | ||
| − | |||
| − | |||
</gallery> | </gallery> | ||
| − | |||
| − | |||
| − | |||
| − | |||
| − | |||
| − | |||
| − | |||
| − | === | + | The above set of images show how to measure angles in Geogebra. |
| − | <gallery mode="packed" heights="250px" caption="Using the | + | |
| − | File: | + | ===Typing text in a textbox=== |
| − | File: | + | <gallery mode="packed" heights="250px" caption="Using the text box"> |
| + | |||
| + | File:Geogebra_textbox.png | ||
| + | File:Showing symbols in textbox.png | ||
| + | File:using defined objects.png | ||
</gallery> | </gallery> | ||
| − | |||
| − | |||
| − | |||
| − | + | The textbox is used to write descriptive text in a Geogebra file. The first image shows you the option in the tool bar which will be used to insert a text box. After selecting the text box option, you can click anywhere on the graphics pad to insert the text box. The next two images show how symbols and prior defined objects can be inserted. For example, in the third image, the "α" object is a prior defined object - the angle measure. This feature allows the text box to dynamically capture the changes in the Geogebra file. | |
| + | |||
| + | ===Defining a slider=== | ||
One of the powerful features of Geogebra is the dynamic feature. You can vary parameters of the shape that you want to animate and see how properties change. | One of the powerful features of Geogebra is the dynamic feature. You can vary parameters of the shape that you want to animate and see how properties change. | ||
<gallery mode="packed" heights="250px" caption="Using the slider"> | <gallery mode="packed" heights="250px" caption="Using the slider"> | ||
File:Geogebra_13_side_slider.png|Defining the slider | File:Geogebra_13_side_slider.png|Defining the slider | ||
File:Geogebra_15a.png|Polygon with a slider for number of sides | File:Geogebra_15a.png|Polygon with a slider for number of sides | ||
| + | </gallery> | ||
#The first image shows you how to define a slider. In the slider dialog box, you can define the name, the range of values for the parameter and the increment to be used. You can either define a slider of sides or angles. | #The first image shows you how to define a slider. In the slider dialog box, you can define the name, the range of values for the parameter and the increment to be used. You can either define a slider of sides or angles. | ||
#The second image shows the construction of a polygon with a slider defined for the number of vertices. | #The second image shows the construction of a polygon with a slider defined for the number of vertices. | ||
| − | + | #In the file you have worked with, a slider has been created for angles. | |
| − | + | #When you define a slider, you can also set up animation on - this keeps changing the value of the parameter and keeps changing the sketch | |
| − | |||
| − | |||
| − | |||
| − | |||
| − | |||
| − | # | ||
| − | # | ||
| − | |||
| − | |||
| − | |||
| − | |||
| − | |||
| − | |||
| − | |||
| − | |||
| − | |||
| − | |||
| − | |||
| − | |||
| − | |||
| − | === | + | ===Defining a checkbox=== |
| − | + | A checkbox is a useful way to control the sequence of display of objects in a Geogebra file and hence can be an useful way to structure a lesson. | |
| − | + | <gallery mode="packed" heights="250px" caption="Using the check box"> | |
| + | File:Geogebra checkbox.png | ||
| + | File:Selecting object linked to checkbox.png </gallery> | ||
| + | The first image above shows where the check box option is located on the menu. Once the check box is selected, click anywhere on the graphics view to create a check box. The display of any created object can be allowed or not allowed by linking it to the checkbox; this is a 1:1 linkage. For each object, a new check box must be created. | ||
| − | === | + | <br> |
| − | + | <gallery mode="packed" heights="250px" caption="Check box created"> | |
| − | + | File:How a checkbox looks.png | |
| − | + | File:Object displays when checkbox is selected.png </gallery> | |
| + | In the first image above, the view shows how a check box looks when created. This check box is linked to the text box describing an angle type; when it is checked the text box displays. Otherwise the text box is not displayed. | ||
| − | [[Category: | + | [[Category:Mathematics]] |
| − | |||
Latest revision as of 03:30, 17 April 2018
File:C01 - Geogebra, April 2018.odt
Getting familiar with the Geogebra interface

The above image shows you the Geogebra window. After opening Geogebra, you will see the application window as above. The user can define the graphics view in terms of the axes, the grid, scale of the axes, etc. The Move button - which allows objects to be moved is highlighted in blue.
Tool bar introduction
In this section you will be introduced to the basic constructions available on the tool bar.
- Introduction to the tool bar
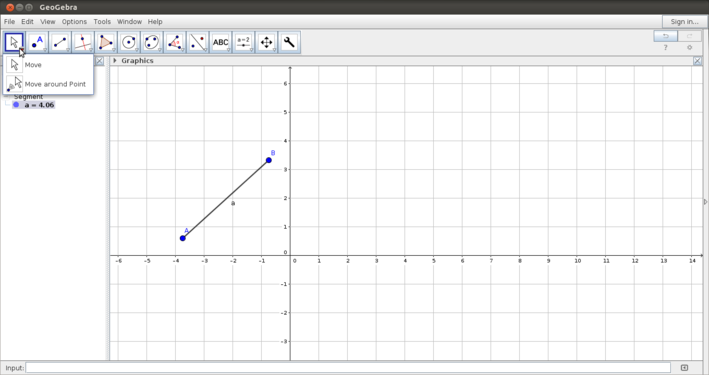
Moving objects
Moving by rotating around a point


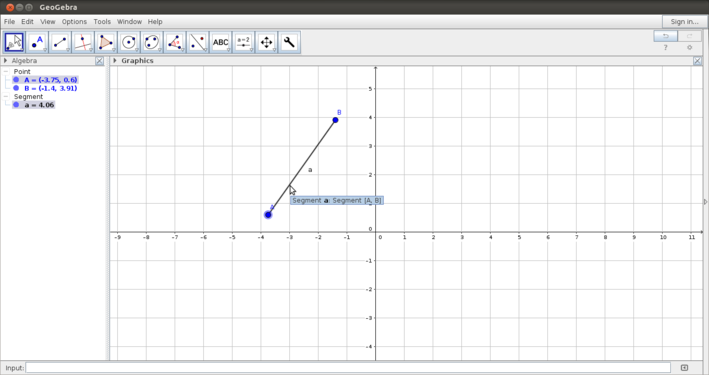
Drawing segments and lines

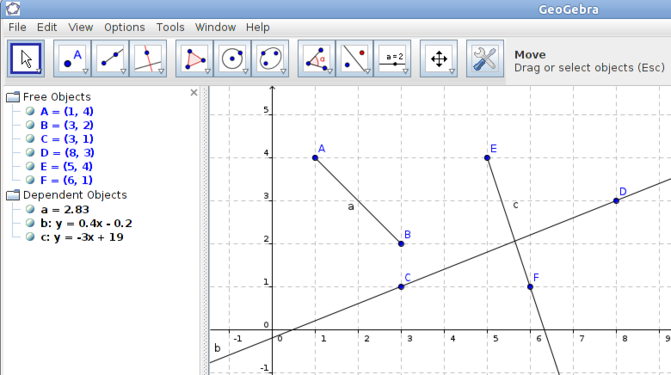
Drawing parallel lines


The Geogebra tool bar is very versatile - the construction follows the processes that we would normally follow in paper and pen construction. Some six important categories in the tool bar are discussed below:
- Moving objects:Geogebra allows you to move object constructed freely by dragging the object. You can also select an object and move it by rotating aroung a point.
- Plotting points: There are different ways of plotting points on the Geogebra graphics pad. You can plot a point anywhere on the graphics view - this is a free point. You can also plot on an object or as an intersection of two objects; in both the cases the point is a dependent object.
- Drawing lines: The menu for lines and segments also allows multiple constructions - segments,lines, rays and vectors
- Drawing multiple lines: Multiple lines can also be drawn in Geogebra. Parallel lines, perpendicular lines, angle bisectors and perpendicular bisectors can be drawn.
Saving and exporting
- You can save Geogebra file from the File menu.
- You can also export the Geogebra file as an image (.png format) or as an animated graphic (.gif format).
- If you export the Geogebra file as html you can publish it on the repository for Geogebra files.
Measuring an angle
- Measuring an angle
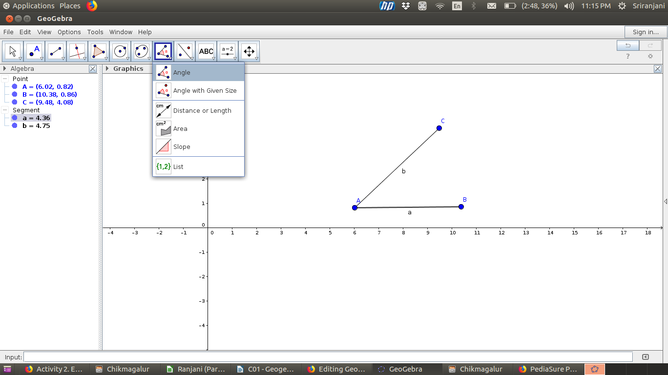
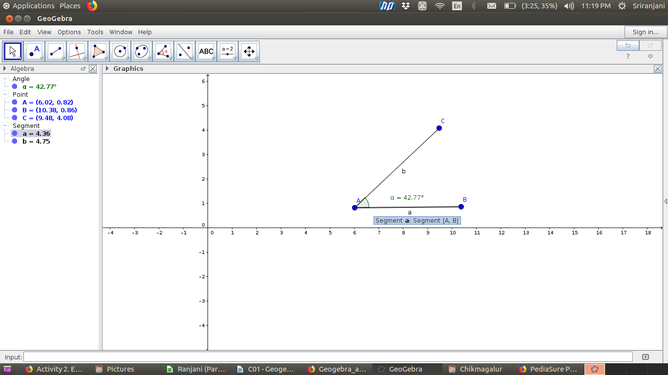


The above set of images show how to measure angles in Geogebra.
Typing text in a textbox
- Using the text box
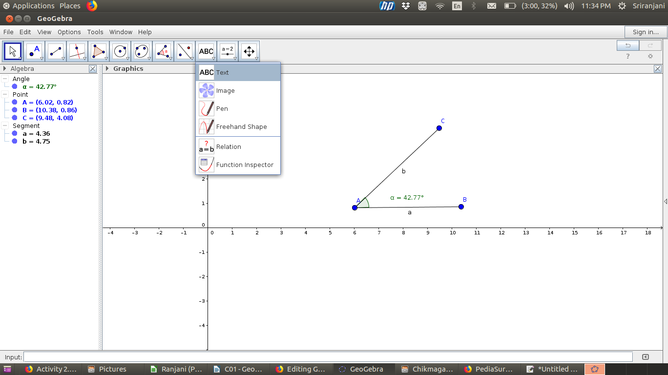
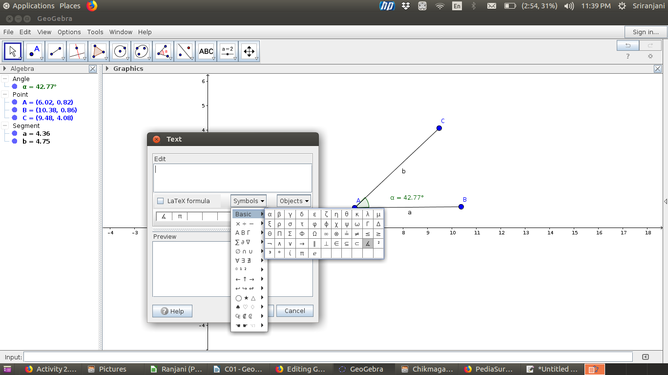
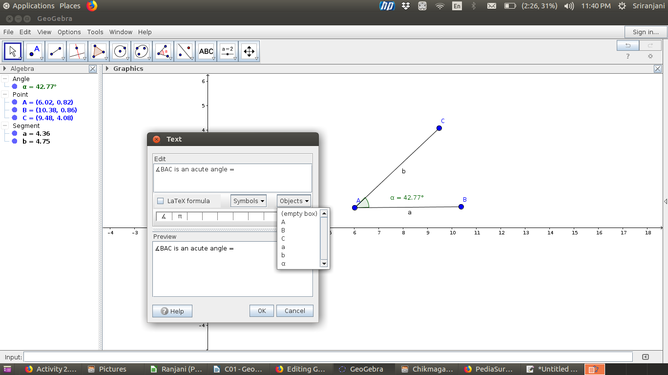


The textbox is used to write descriptive text in a Geogebra file. The first image shows you the option in the tool bar which will be used to insert a text box. After selecting the text box option, you can click anywhere on the graphics pad to insert the text box. The next two images show how symbols and prior defined objects can be inserted. For example, in the third image, the "α" object is a prior defined object - the angle measure. This feature allows the text box to dynamically capture the changes in the Geogebra file.
Defining a slider
One of the powerful features of Geogebra is the dynamic feature. You can vary parameters of the shape that you want to animate and see how properties change.
- Using the slider
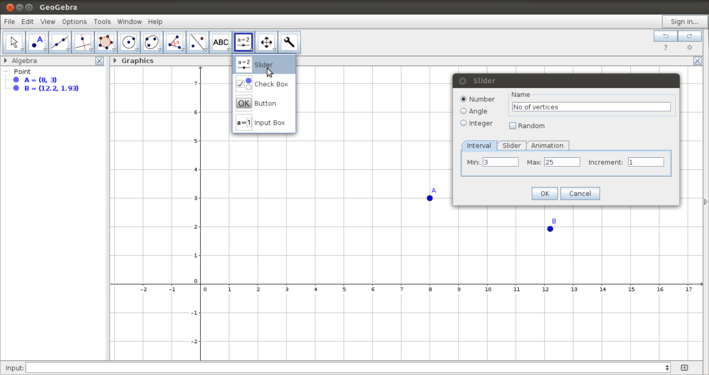
Defining the slider
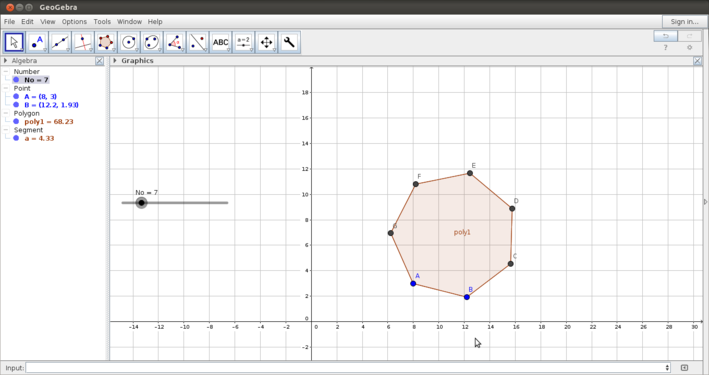
Polygon with a slider for number of sides


- The first image shows you how to define a slider. In the slider dialog box, you can define the name, the range of values for the parameter and the increment to be used. You can either define a slider of sides or angles.
- The second image shows the construction of a polygon with a slider defined for the number of vertices.
- In the file you have worked with, a slider has been created for angles.
- When you define a slider, you can also set up animation on - this keeps changing the value of the parameter and keeps changing the sketch
Defining a checkbox
A checkbox is a useful way to control the sequence of display of objects in a Geogebra file and hence can be an useful way to structure a lesson.
- Using the check box
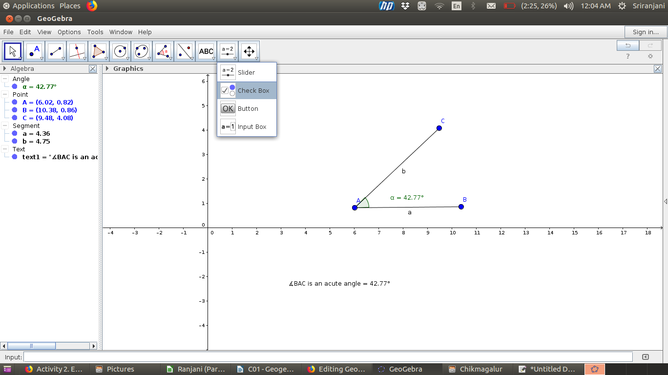
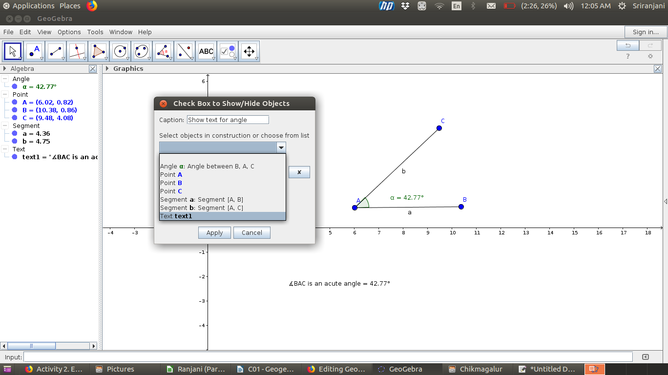


The first image above shows where the check box option is located on the menu. Once the check box is selected, click anywhere on the graphics view to create a check box. The display of any created object can be allowed or not allowed by linking it to the checkbox; this is a 1:1 linkage. For each object, a new check box must be created.
- Check box created
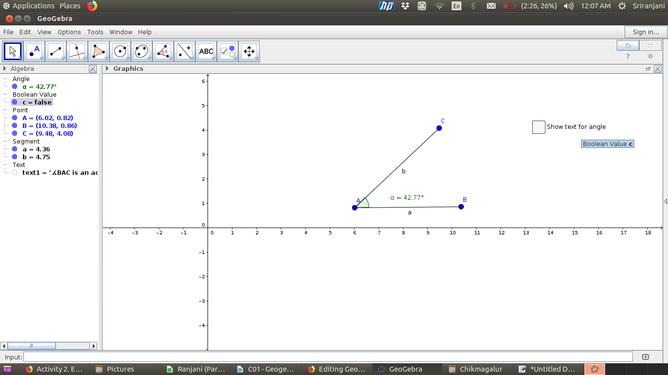
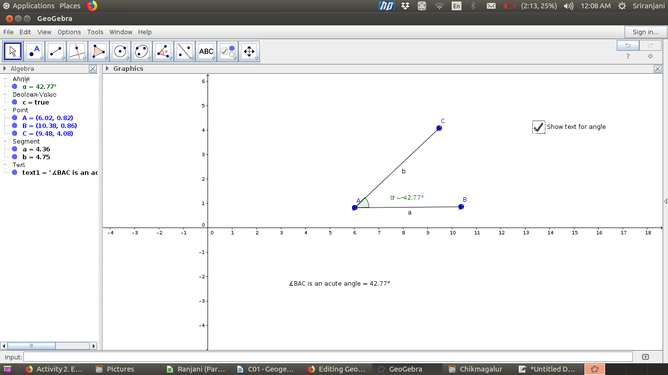


In the first image above, the view shows how a check box looks when created. This check box is linked to the text box describing an angle type; when it is checked the text box displays. Otherwise the text box is not displayed.