Learn PhET
Introduction
PhET is a collection of simulations that can be integrated in classroom teaching-learning. We will look at two examples of simulations.
PhET provides fun, free, interactive, research-based science and mathematics simulations. We extensively test and evaluate each simulation to ensure educational effectiveness. These tests include student interviews and observation of simulation use in classrooms. The simulations are written in Java, Flash or HTML5, and can be run online or downloaded to your computer. All simulations are open source (see our source code). Multiple sponsors support the PhET project, enabling these resources to be free to all students and teachers.
ICT Competency
For this we will need to open an application called PhET on the computer. You can find PhET under Applications> Education> Science. PhET is an educational resource that contains computer demonstrations of experiments and activities. When we click on Play with sims – it will open simulations in various subjects. We will click on Physics and scroll down to the simulation on Pendulum Lab. When we want to open a simulation, we click on the green rectangle which says “Run Now”.
Educational application and relevance
PhET simulations are very flexible tools that can be used in many ways. Here, you will find videos and resources for learning about effective ways of integrating PhET simulations into your class.
Version
1.1.7
Configuration
System tools → preferences → main menu → Select science → Click on NEW ITEM → Name – PhET → Command- firefox /opt/PhET/index.html → OK
Overview of Features
Other similar applications
Virtual Laboratory
Development and community help
Working with the application
Functionalities
- Please label images as Step 1
- Please add 500px

|

|
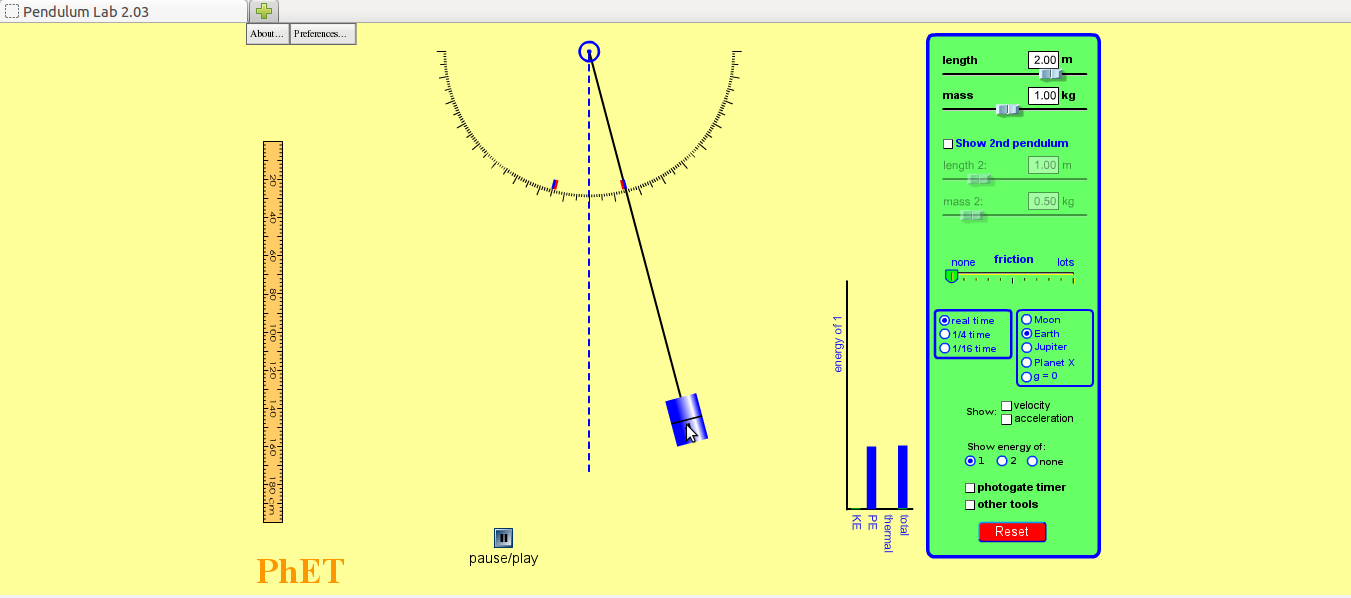
| Step 1 - 1. Notice where the pendulum is – is it higher, lower or at the same level as the central position?
2. Notice the graph – what are the two variables on the bar chart? 3. What do you think will happen to the pendulum next? |
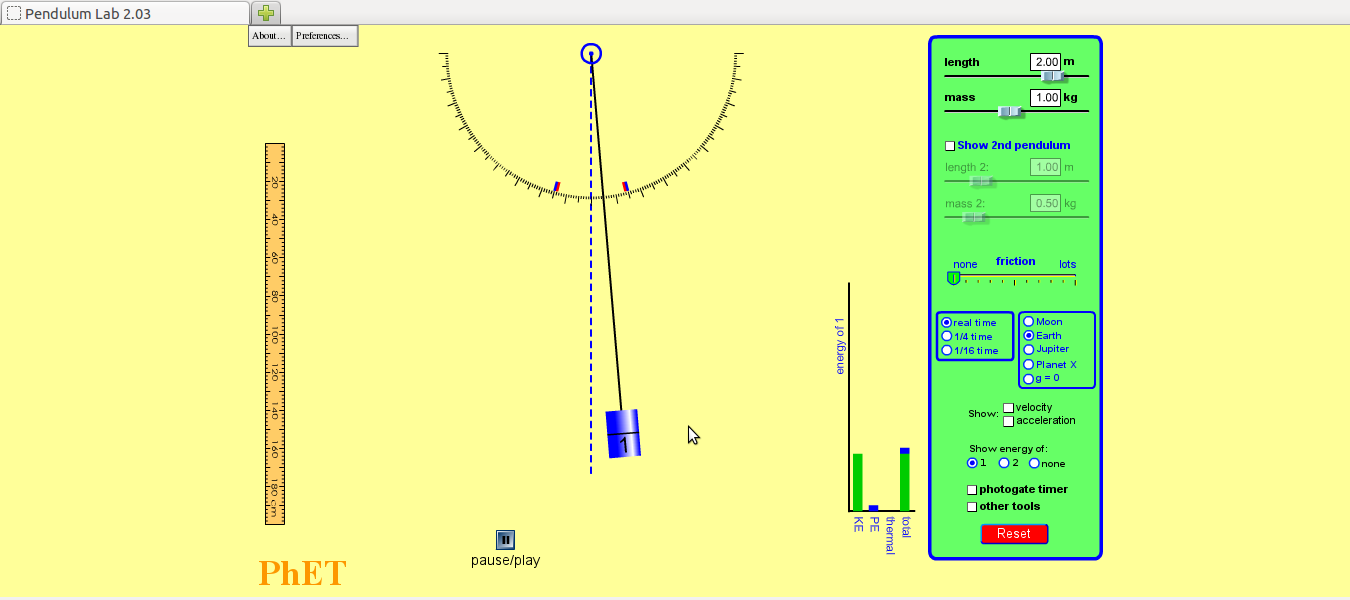
Step 2 - 4. Notice where the pendulum is – has it moved? What can you say about its movement?
5. Notice the graph – what are the variables on the bar chart? What are the values of PE and KE as compared to total energy? |

|

|
| Step 3 - 6. Notice where the pendulum is – has it moved? Is it higher or lower than the central position?
7. Did you notice anything about the speed of the bob as it moves from one extreme position to another? 8. Notice the graph – what are the variables on the bar chart? 9. What has happened to the values of the KE and PE as compared to total energy? 10. What do you think is happening? Is this what you will think will happen when you try this experiment? Why? Why not? What is different? |
Step 4 - 11. Notice where the pendulum is. This extreme position to the right is at a different height than. Why? What role does friction play and where does it come from
12. Look at the graph – what are the variables in the bar chart? Where has the thermal energy come from? What do you expect will happen to the simple pendulum? |
File formats for creation
Saving the file
Web link can save its in .html
Export and publishing files
Advanced features
Installation
| Method of installation | Steps |
|---|---|
| From Ubuntu software Centre | Steps |
| From Terminal | Steps |
| From the web | Steps |
| Web based registration | Steps |
The application on mobiles and tablets
PhET can also be downloaded for the mobile from Google Playstore
Ideas for resource creation
References
How to use template
{{subst:Explore_an_application}} on the page you create for your tool. Page Name should be "Learn ToolName"