ICT student textbook/Data can tell stories
Jump to navigation
Jump to search
Data can tell stories

Objectives
- Understand that data can be in different formats
- Reading different kinds of data to make meaning
- Analyzing data aand expressing
What prior skills are assumed
- Creating folders and saving files
- Opening a given file with the correct application
- Familiarity with using a key board
Resources needed
- Computer lab with projection
- Access to internet
- Data in the form of bar graphs, pictographs, maps (images)
- Handout for Ubuntu
- Handout for Tux Typing
- Handout for LibreOffice Writer
- Handout for Freeplane
Digital skills
- Navigating a folder
- Opening multiple files with multiple applications
- Text entry (local languages)
Description of activity with detailed steps
Teacher led activity

|

|
|
Student activities
- On each of the computers, you will find folders with different data sets.
- Each group of students will get one data set to work with - this will comprise maps, satellite images, pictographs and bar graphs. Your teacher will also give you a set of questions for each data set.
- Make a concept map of what you understand with the data
- You can also add your findings in a text document.
In the workshop, teachers are requested to identify more data sets along similar lines which can be added as additional student activities
Rainfall

|

|

|

|
Pictographs-one per group

|

|

|

|
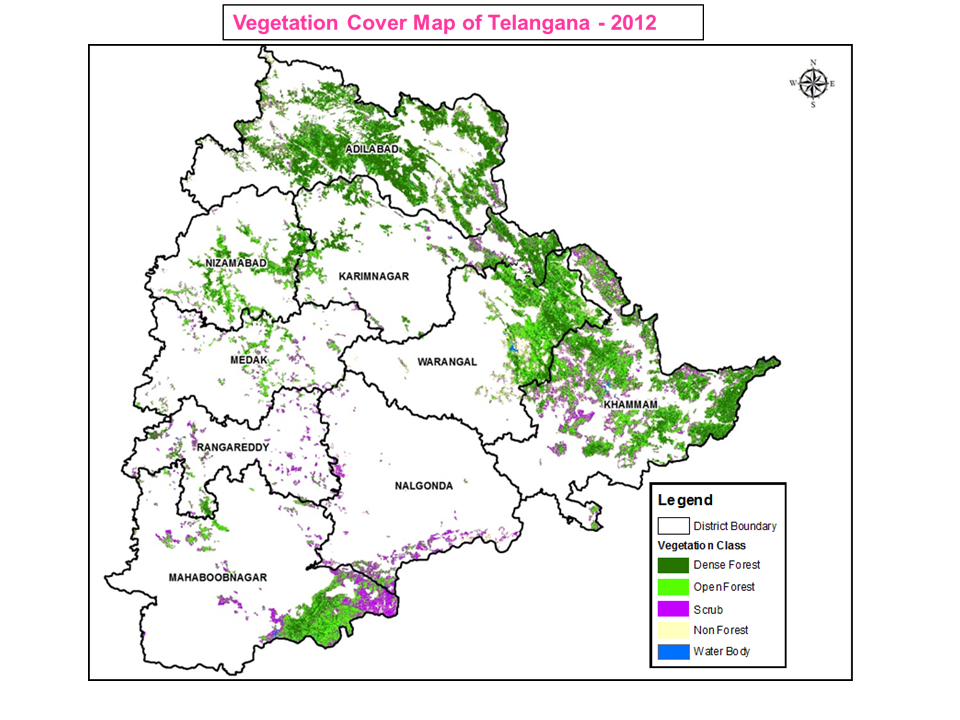
India's forests

|

|
|

|
Portfolio
- Make a concept map, as shown by your teacher, to share your findings:
- What is the data about
- What forms of representation did you study?
- What are the advantages of each representation?
- What did you conclude from the data?
- Have you studied about this before?
- What more do you want to know
- Text document with your understanding of the data