Difference between revisions of "ICT student textbook/Data can tell stories"
Jump to navigation
Jump to search
| Line 7: | Line 7: | ||
|}</div> | |}</div> | ||
| − | =Objectives= | + | ==Objectives== |
#Understand that data can be in different formats | #Understand that data can be in different formats | ||
#Reading different kinds of data to make meaning | #Reading different kinds of data to make meaning | ||
| − | #Analyzing | + | #Analyzing data aand expressing |
| − | =What prior skills are assumed= | + | ==What prior skills are assumed== |
#[[Learn Ubuntu|Creating folders and saving files]] | #[[Learn Ubuntu|Creating folders and saving files]] | ||
#Opening a given file with the correct application | #Opening a given file with the correct application | ||
#[[Learn Tux Typing|Familiarity with using a key board]] | #[[Learn Tux Typing|Familiarity with using a key board]] | ||
| − | =Resources needed = | + | ==Resources needed == |
| − | |||
| − | |||
#Computer lab with projection | #Computer lab with projection | ||
#[[Learn Firefox|Access to internet]] | #[[Learn Firefox|Access to internet]] | ||
| − | #Handout | + | #Data in the form of bar graphs, pictographs, maps (images) |
| − | #Handout | + | #Handout for [[Learn Ubuntu|Ubuntu]] |
| − | =Digital skills= | + | #Handout for [[Learn Tux Typing|Tux Typing ]] |
| + | #Handout for [[Learn LibreOffice Writer|LibreOffice Writer]] | ||
| + | #Handout for [[Learn Freeplane|Freeplane]] | ||
| + | ==Digital skills== | ||
#Navigating a folder | #Navigating a folder | ||
#Opening multiple files with multiple applications | #Opening multiple files with multiple applications | ||
#Text entry (local languages) | #Text entry (local languages) | ||
| − | =Description of activity with detailed steps= | + | ==Description of activity with detailed steps== |
| − | ==Teacher led activity== | + | ===Teacher led activity=== |
{| class="wikitable" | {| class="wikitable" | ||
|- | |- | ||
| Line 36: | Line 37: | ||
| style="width: 25%;" |[[File:Solar_Resource_Map_of_India.png|200px|Solar Resource in India]] | | style="width: 25%;" |[[File:Solar_Resource_Map_of_India.png|200px|Solar Resource in India]] | ||
| style="width: 40%;" | | | style="width: 40%;" | | ||
| − | # | + | #Look at these examples of data representation in the form of a graph with your teacher. |
#In small groups, discuss what are the various kinds of analysis you can make from this graph. | #In small groups, discuss what are the various kinds of analysis you can make from this graph. | ||
| − | #Your teacher will summarize this analysis using a text document. | + | #Your teacher will summarize this analysis using a concept map or text document. |
|} | |} | ||
| − | ==Student activities== | + | ===Student activities=== |
| − | # | + | #On each of the computers, you will find folders with different data sets. |
| − | # Each group of students will get one data set to work with - this will comprise maps, satellite images, pictographs and bar graphs. Your teacher will also give you a set of questions for each data set. | + | #Each group of students will get one data set to work with - this will comprise maps, satellite images, pictographs and bar graphs. Your teacher will also give you a set of questions for each data set. |
| − | # # | + | ##Make a concept map of what you understand with the data |
| + | ##You can also add your findings in a text document. | ||
'''Rainfall''' | '''Rainfall''' | ||
{| class="wikitable" | {| class="wikitable" | ||
| Line 70: | Line 72: | ||
|} | |} | ||
| − | =Portfolio= | + | ==Portfolio== |
#Make a concept map, as shown by your teacher, to share your findings: | #Make a concept map, as shown by your teacher, to share your findings: | ||
##What is the data about | ##What is the data about | ||
| Line 78: | Line 80: | ||
##Have you studied about this before? | ##Have you studied about this before? | ||
##What more do you want to know | ##What more do you want to know | ||
| − | #Text document with | + | #Text document with your understanding of the data |
Revision as of 23:24, 21 November 2016
Data can tell stories

Objectives
- Understand that data can be in different formats
- Reading different kinds of data to make meaning
- Analyzing data aand expressing
What prior skills are assumed
- Creating folders and saving files
- Opening a given file with the correct application
- Familiarity with using a key board
Resources needed
- Computer lab with projection
- Access to internet
- Data in the form of bar graphs, pictographs, maps (images)
- Handout for Ubuntu
- Handout for Tux Typing
- Handout for LibreOffice Writer
- Handout for Freeplane
Digital skills
- Navigating a folder
- Opening multiple files with multiple applications
- Text entry (local languages)
Description of activity with detailed steps
Teacher led activity

|

|
|
Student activities
- On each of the computers, you will find folders with different data sets.
- Each group of students will get one data set to work with - this will comprise maps, satellite images, pictographs and bar graphs. Your teacher will also give you a set of questions for each data set.
- Make a concept map of what you understand with the data
- You can also add your findings in a text document.
Rainfall

|

|

|

|
Pictographs-one per group

|

|

|

|
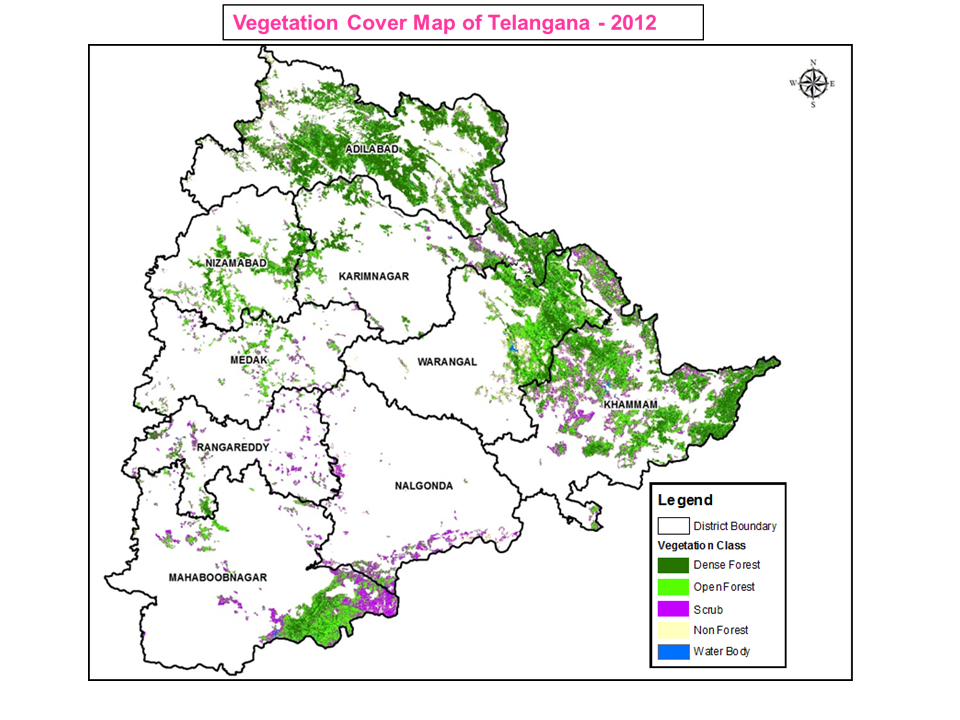
India's forests

|

|
|

|
Portfolio
- Make a concept map, as shown by your teacher, to share your findings:
- What is the data about
- What forms of representation did you study?
- What are the advantages of each representation?
- What did you conclude from the data?
- Have you studied about this before?
- What more do you want to know
- Text document with your understanding of the data